Gold's Downside Break
by Ashraf Laidi
Apr 6, 2009 12:16 | 11 Comments

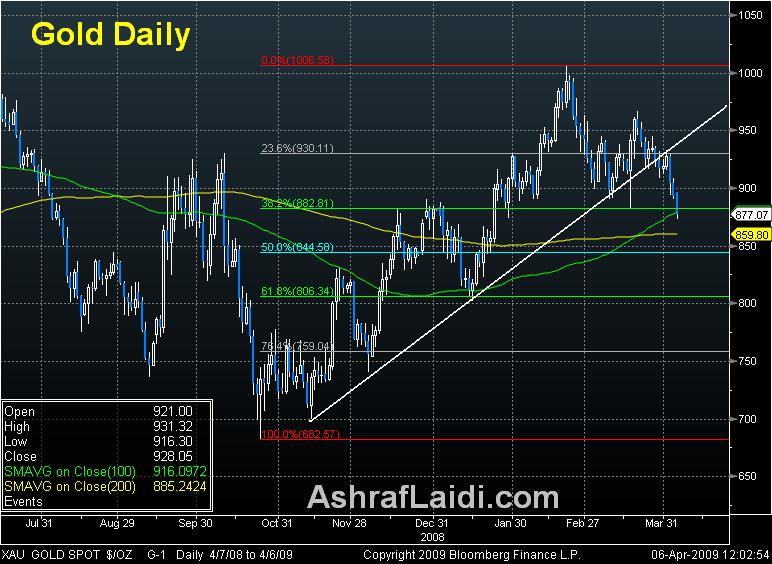
Gold's Downside Break - Gold Apr 6 (Chart 1)

Golds break below 880 support (38% retracement of the rise from the Oct lows) has been partly brought about by the broadening of the equity market bouncesector rotation beyond health care and into technology and financials away from metals. Last weeks IMF announcement to allow gold sales for funding was also instrumental in accelerating golds retreat. A close below the 100-day MA of 878 should pave the way for the $855-860 territory, which is both the 200-DAY and 50-WEEK moving averages. A break below this level could start looking like the beginning of a Head&Shoulder.


More Hot-Charts

  • DAX40 Germany40

    Nov 22, 2024 17:50 | by Ashraf Laidi
    .
  • MSTR 545

    Nov 20, 2024 12:29 | by Ashraf Laidi
    Listen to the voice note sent to the WhatsApp Bdcst Group for detailed explanation of these charts - استمع إلى الملاحظة الصوتية المرسلة إلى مجموعة الواتساب الخاصة للحصول على شرح مفصل لهذه...
  • EURGBP Latest

    Nov 11, 2024 13:38 | by Ashraf Laidi
    There are two important messages from this chart. I will share them with the WhatsApp Broadcast Group shortly..
Hot-Chart Archives
Comments (Showing latest 10 of 11) View All Comments
Ashraf Laidi
London, UK
Posts: 0
16 years ago
Apr 8, 2009 18:05
Cappy, Shortterm silver chart may appear bearish (bearish divergence between falling daily stochastics and rising price). Last 2 daily sessions regained the 38% retracement of $12.29 and is now approaching the 200-day MA of $12.58 (also trend line resists), which if broken may trigger $13.15. I myself am long silver.

Ashraf
Cappy
United States
Posts: 19
16 years ago
Apr 8, 2009 3:21
Hi Ashraft,

Do you see silver LT bull market? If so, where do you see it stopping at?

Thanks again,

Cappy
Ashraf Laidi
London, UK
Posts: 0
16 years ago
Apr 6, 2009 19:17
Carico, hope you enjoy the book. Chapters 3 & 4 were written for people to understand what happened to each major currency between 1999 and 2007 and more importantly WHY. 1999 for isnatance proved almost like 2008, as far as FX performance.

As for Gold, with 859 being the 200-day MA, i use the 840 support, which is just below the 50% retracement at 844.00.

Best

Ashraf
Carlco
bristol, UK
Posts: 151
16 years ago
Apr 6, 2009 18:03
ashraf im on chapter 4 of your book, it's a really great book for historical reference points, ive been following your bullish argument about gold target $1000-$1200 medium long term (6months??) do you think this is retracement in gold is down to the g20 obama effect? surely with more money and quantative easing being implemented in various degrees around the world would put pressure on a gold price resurgence, could you explain WHY $840 is such a key support level for you?
Ashraf Laidi
London, UK
Posts: 0
16 years ago
Apr 6, 2009 17:06
TLS, Yes, my analysis about $1,000 was wrong. At least for now. But im still LT bullish gold.

Ashraf
Ashraf Laidi
London, UK
Posts: 0
16 years ago
Apr 6, 2009 17:04
Apache, watch 840 as the key support.

Cappy, I wrote a whole chapter (chapter 5) on risk appetite in my book. It is the only book that has a whole chapter on the topic, relating it to FX, equities and interest rates. Higher risk appetite usually means stocks are going up and yen and dollar are going down and vice versa.

Ashraf
TLS
Singapore
Posts: 1
16 years ago
Apr 6, 2009 16:11
Hi Ashraf,
Will that mean that it will not break the 1000 point as expected in end april?? Thanks.
Cappy
United States
Posts: 19
16 years ago
Apr 6, 2009 16:03
Hi Ashraft,

Would you please define risk appetite? I can't find a definition for this so often used term anyway. Thanks!

Cappy
apache99sg
Singapore
Posted Anonymously
16 years ago
Apr 6, 2009 15:19
Ahsraf, does this look like gold is heading into downtrend, rather than retracement? If it is retracement, what level do you see as confirmation of downtrend?

thanks!
Ashraf Laidi
London, UK
Posts: 0
16 years ago
Apr 6, 2009 14:48
HD, not really. there are other support levels below which i mentioned. And it depends on your risk tolerance and margin limitations.

CAD figures coming up (PMI an Buidling Permits at 15:00 GMT). Watch USDCAD breaking towards 1.2430 and 1.2470 later today from current 1.2380.

Ashraf