FTSE Fears UK Budget

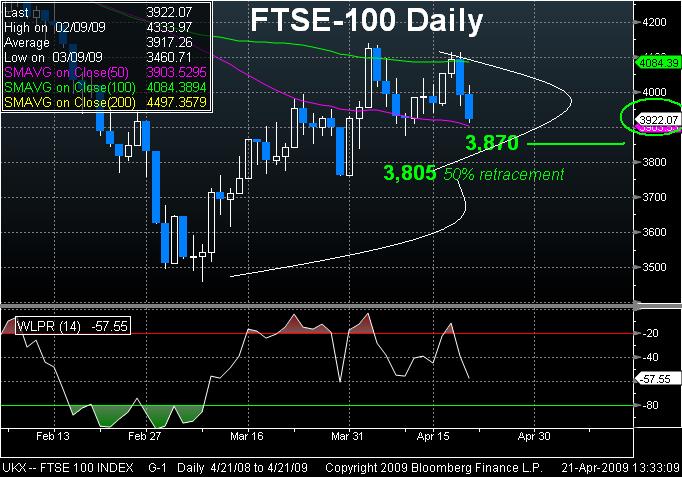
FTSE-100 outlook looks increasingly shaky as the index is dragged by broadening UK concerns (tomorrows budget, unemployment, GDP and retail sales). Recall that FTSE-100 rose 20% from its March lows compared to 31% and 27% for the S&P500 and the Dow. Prolonged losses seen targeting 3,875 as early as today , which is the target from the current Head&Shoulder formation as well as the 38% retracement of the rally from the March lows to the April highs. Index attempts holding above 3,900 (55-day MA), but prolonged losses may intensify ahead of tomorrows event risk.
More Hot-Charts
-

Mystery Charts
Feb 5, 2026 20:48 | by Ashraf Laidiسأرسل رسالة صوتية و كتابية توضيحية لأعضاء مجموعة الواتساب الخاصة حول هذه المخططات Will send detailed note on latest parameters to our WhatsApp Bdcst Group... -

2hr Gold Chart
Feb 3, 2026 13:09 | by Ashraf Laidiسأرسل رسالة صوتية و كتابية توضيحية لأعضاء مجموعة الواتساب الخاصة حول هذه المخططات Will send detailed note on latest parameters to our WhatsApp Bdcst Group... -

Gold Net Longs
Feb 2, 2026 17:16 | by Ashraf LaidiI really dislike after-the-fact analysis, but looking at this chart of Gold speculative net longs at the Comex, it shows speculators began lightening their longs on Jan 23.


