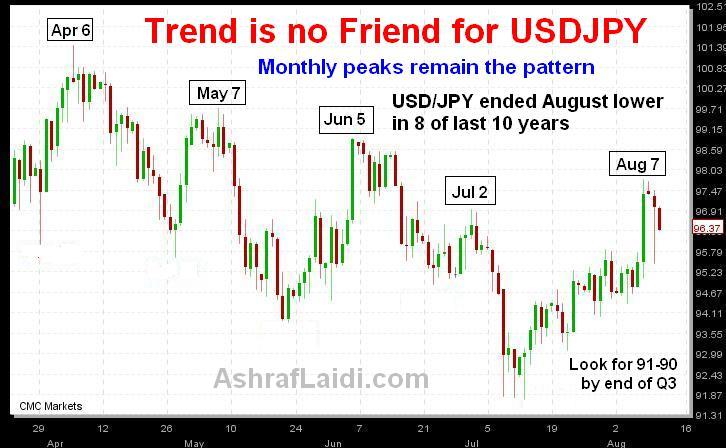
USDJPY Cyclical Peaks

Last month we looked at cyclical lows in USDPY and how they helped us predict the 91.75 low. Today, we examine the cyclical peaks in the pair. Despite last weeks aggressive rebound in USDJPY to 3-week highs following US July payrolls, the trend remains that of a generally strong yen. The chart illustrates the last 5 five major peaks occurred over 4-week intervals during the last 4 months, with last Friday being the most recent peak. Emerging signs of economic stabilization in Japan may have in the past been accompanied by subsequent declines in JPY as improved Japanese investor appetite encouraged outflows into foreign equities.
But with Japanese equity indices outperforming their G7 counterparts (Nikkei-225 and Topix-20 +19% and 15% respectively YTD), the usual capital bleed from Japan is not happening. And with the Bank of Japan maintaining its economic assessment unchanged, indicating a bottom in the pace of deteriorating, the case for the yen is far from over. The usual repatriation by Japanese institutional investors ahead of the end of the first half of the fiscal on Sep 30 has also contributed to selling pressure during August. USDJPY ended August lower in each year of the last 10 years with the exception of 2006 and 2008. Expect a preliminary target of 93.00, followed by 91 before end of September. Aggressive sell-off below 90 seen in October.
More Hot-Charts
-

Mystery Charts
Feb 5, 2026 20:48 | by Ashraf Laidiسأرسل رسالة صوتية و كتابية توضيحية لأعضاء مجموعة الواتساب الخاصة حول هذه المخططات Will send detailed note on latest parameters to our WhatsApp Bdcst Group... -

2hr Gold Chart
Feb 3, 2026 13:09 | by Ashraf Laidiسأرسل رسالة صوتية و كتابية توضيحية لأعضاء مجموعة الواتساب الخاصة حول هذه المخططات Will send detailed note on latest parameters to our WhatsApp Bdcst Group... -

Gold Net Longs
Feb 2, 2026 17:16 | by Ashraf LaidiI really dislike after-the-fact analysis, but looking at this chart of Gold speculative net longs at the Comex, it shows speculators began lightening their longs on Jan 23.


