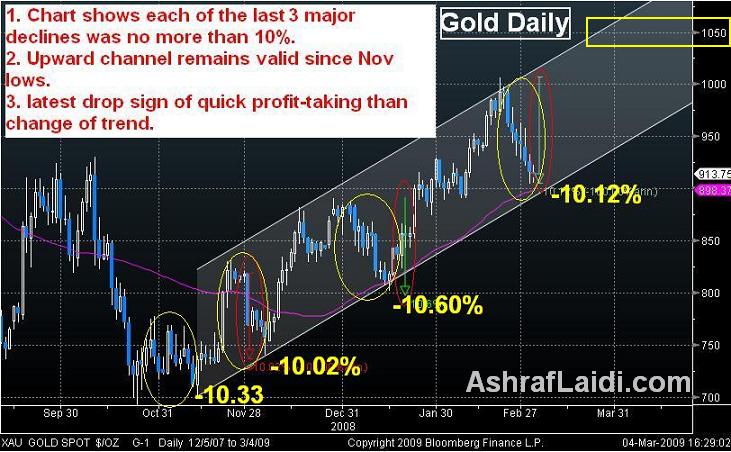
Gold Eyeing $1.050

Golds recovers to $939 confirming my Monday call about the validity of the 4-month uptrend, especially that each of the last four declines was limited to 10% (Nov -10.3%, Nov-Dec -10.0%, Dec-Jan -10.6%, Feb-Mar -10.12%). None of the most 2 recent declines has breached below the 50-day moving average. Fundamentally, the currency implications of central banks quantitative easing and bank stocks accelerating damage. Last years 1,038 high is increasingly untenable and the $1,200 target by end of Q2 becomes more viable. Interim target stands at $1,050.
More Hot-Charts
-

Mystery Charts
Feb 5, 2026 20:48 | by Ashraf Laidiسأرسل رسالة صوتية و كتابية توضيحية لأعضاء مجموعة الواتساب الخاصة حول هذه المخططات Will send detailed note on latest parameters to our WhatsApp Bdcst Group... -

2hr Gold Chart
Feb 3, 2026 13:09 | by Ashraf Laidiسأرسل رسالة صوتية و كتابية توضيحية لأعضاء مجموعة الواتساب الخاصة حول هذه المخططات Will send detailed note on latest parameters to our WhatsApp Bdcst Group... -

Gold Net Longs
Feb 2, 2026 17:16 | by Ashraf LaidiI really dislike after-the-fact analysis, but looking at this chart of Gold speculative net longs at the Comex, it shows speculators began lightening their longs on Jan 23.


