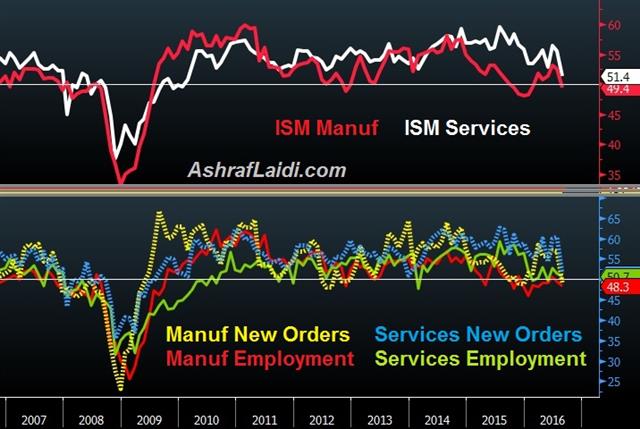
Breaking down Manuf & Services ISM
Six days after the manufacturing ISM index dived back into contraction territory along with its employment and new orders components, today's release of the services version does its part of deterioration, hitting 5 1/2 year lows at 51.4 from 55.5. All 4 major components declined, led by a plunge in new orders to 51.4 from 60.3. Probabilities of a Sept Fed hike dropped to 24% from 34% prior to the data. The charts below tell the full story of the services and manufacturing ISMs.

More Hot-Charts
-

Mystery Charts
Feb 5, 2026 20:48 | by Ashraf Laidiسأرسل رسالة صوتية و كتابية توضيحية لأعضاء مجموعة الواتساب الخاصة حول هذه المخططات Will send detailed note on latest parameters to our WhatsApp Bdcst Group... -

2hr Gold Chart
Feb 3, 2026 13:09 | by Ashraf Laidiسأرسل رسالة صوتية و كتابية توضيحية لأعضاء مجموعة الواتساب الخاصة حول هذه المخططات Will send detailed note on latest parameters to our WhatsApp Bdcst Group... -

Gold Net Longs
Feb 2, 2026 17:16 | by Ashraf LaidiI really dislike after-the-fact analysis, but looking at this chart of Gold speculative net longs at the Comex, it shows speculators began lightening their longs on Jan 23.


