


EURGBP Revisited
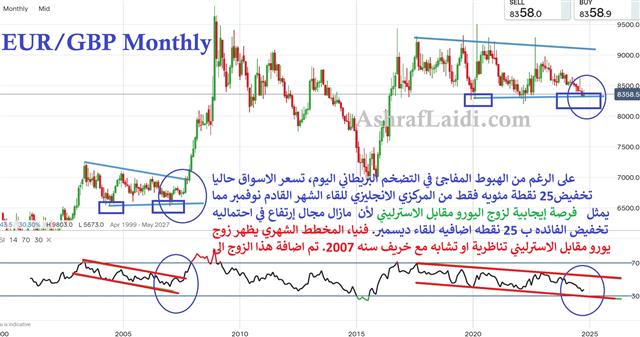
Is it time to look at EURGBP again? Following today's larger than expected fall in inflationMarkets are now fully pricing a BoE rate cut of of 25-bps in November, while partly (not) fully pricing another 25-bp cut in December. These are not a lot of rate cuts and that is why GBP has retraced most of its losses from earlier today. This, however, can also be a source of upside opportunity for EURGBP longs (pros call it non-priced Upside risk). The monthly chart below, strictly from a technical stand point, displays an analogous pattern with September/November 2007 (yes, again with the 2007 fractals), suggesting potential upside from a price and RSI stand point. Let's keep this in our radar and will update the WhatsApp Bdcast Group members on it into upcoming 3 weeks.
More Hot-Charts
-
Gold & Nasdaq100
Sep 28, 2026 10:32 | by Ashraf Laidiسأرسل رسالة صوتية و كتابية توضيحية لأعضاء مجموعة الواتساب الخاصة حول هذه المخططات - Will send detailed note on latest parameters to our WhatsApp Bdcst Group... -

Gold & GoldBugs
Sep 24, 2026 11:51 | by Ashraf LaidiIf the inverse relation between gold and goldbugs index explained repeatedly in previous videos such as here and here continues to work, then watching the 4230 level is as important as... -
Nasdaq Part 2
Sep 24, 2026 9:44 | by Ashraf LaidiNow that Nasdaq has fallen following yesterday's post, will it extend declines to 30000. What do you think of this fractal.