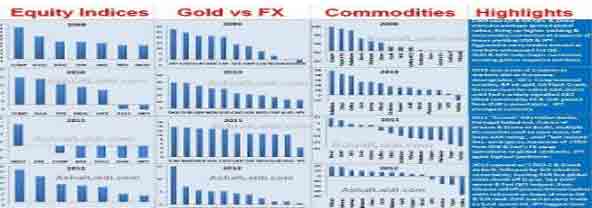
Intermarket Breakdown of 11 Currencies, 7 Indices & 14 Commodities
The following is a representation of the cross-market performances over the last 4 years, used to highlight existing and shifting relationships underpinning currencies, equities and commodities.
In assessing a currency's overall strength, we measure its performance against gold, thus gives us each currencies' secular performance against a common dominator. The “GOLD vs FX” COLUMN shows gold increased the most against JPY in 2012, implying that JPY is the weakest currency. Conversely, NZD is the strongest performing currency of 2012 because gold showed the smallest increase against it.
- Find out the 4 similarities in Intermarket Dynamics between 2009 and 2012
- How did Gold fare against currency baskets & what it means for 2013?
- Commodity Performance Charts on : BRENT, WTI, GOLD, SILVER, COPPER, PLATINUM, PALLADIUM, WHEAT, CORN, COTTON, COFFEE , SUGAR & SOYBEANS

For FULL VIEW OF ABOVE CHART & COMPLETE ANALYSIS & ACCOMPANYING COMMENTARY, PLEASE CLICK HERE http://ashraflaidi.com/premium/4-year-intermarket-performance-analysis to get direct access to JAN 7 PREMIUM REPORT. - NON-MEMBERS, can join here: http://ashraflaidi.com/premium
More Hot-Charts
-

Mystery Charts
Feb 5, 2026 20:48 | by Ashraf Laidiسأرسل رسالة صوتية و كتابية توضيحية لأعضاء مجموعة الواتساب الخاصة حول هذه المخططات Will send detailed note on latest parameters to our WhatsApp Bdcst Group... -

2hr Gold Chart
Feb 3, 2026 13:09 | by Ashraf Laidiسأرسل رسالة صوتية و كتابية توضيحية لأعضاء مجموعة الواتساب الخاصة حول هذه المخططات Will send detailed note on latest parameters to our WhatsApp Bdcst Group... -

Gold Net Longs
Feb 2, 2026 17:16 | by Ashraf LaidiI really dislike after-the-fact analysis, but looking at this chart of Gold speculative net longs at the Comex, it shows speculators began lightening their longs on Jan 23.


