Nasdaq100 Daily & Weekly
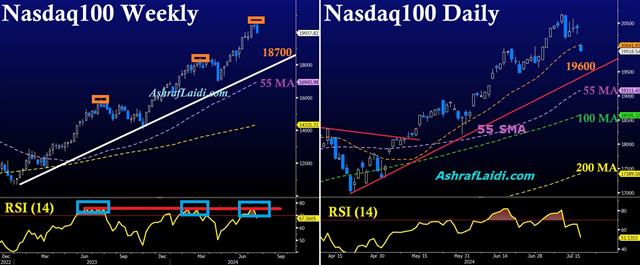
The triple top in weekly RSI suggests the following price and time implications:
PRICE: 18700. TIME: Duration of downside may last for another 3 to 4 weeks. This means downside in technology may last into late August, when Nvidia releases its next earnings (August 28), 2 days before the much anticipated annual Federal Reserve Symposium in Jackson Hole, where Powell will give an important update on monetary policy, much needed as it comes 3 weeks after the July FOMC and 3 weeks before the September FOMC. Ive already mentioned the 2 fundamental reasons to the Nasdaq selloff to the WhatsApp Bdcast Group. I will explain the meanings of the labeled prices to the Group after this post.

More Hot-Charts
-

Mystery Charts
Feb 5, 2026 20:48 | by Ashraf Laidiسأرسل رسالة صوتية و كتابية توضيحية لأعضاء مجموعة الواتساب الخاصة حول هذه المخططات Will send detailed note on latest parameters to our WhatsApp Bdcst Group... -

2hr Gold Chart
Feb 3, 2026 13:09 | by Ashraf Laidiسأرسل رسالة صوتية و كتابية توضيحية لأعضاء مجموعة الواتساب الخاصة حول هذه المخططات Will send detailed note on latest parameters to our WhatsApp Bdcst Group... -

Gold Net Longs
Feb 2, 2026 17:16 | by Ashraf LaidiI really dislike after-the-fact analysis, but looking at this chart of Gold speculative net longs at the Comex, it shows speculators began lightening their longs on Jan 23.


