Hot-Charts
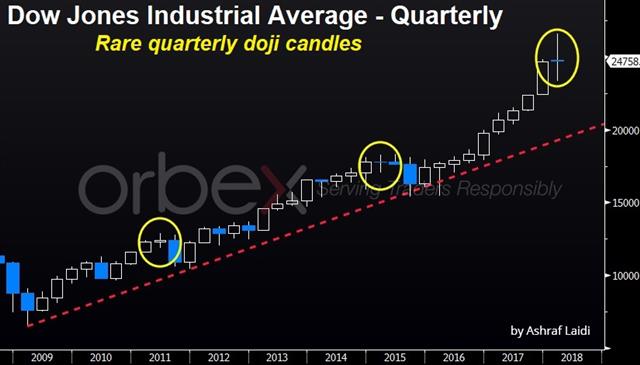
Rare Quarterly Dow Doji
by
Mar 20, 2018 11:02
The quarterly candle on the Dow Jones Industrials Average shows a rare long-legged doji, one of the most striking reversal signs in candlestick analysis. Full Analysis.
More Hot-Charts
-

Gold Channel ABC and D
Jan 8, 2026 16:27 | by Ashraf Laidiسأرسل رسالة صوتية و كتابية توضيحية لأعضاء مجموعة الواتساب الخاصة حول هذه المخططات - Will send detailed note on latest parameters to our WhatsApp Bdcst Group - -... -

EURUSD Next
Jan 5, 2026 17:09 | by Ashraf LaidiIf EURUSD holds Monday above 1.17, it will show a hammer candle, supported above the 100-day moving average. -
Gold Next Move
Dec 26, 2025 15:32 | by Ashraf LaidiWill send detailed note on latest parameters to our WhatsApp Bdcst Group - سأرسل رسالة صوتية و كتابية توضيحية لأعضاء مجموعة الواتساب الخاصة حول هذه المخططات - ..


