This was Never Seen Before in Stocks
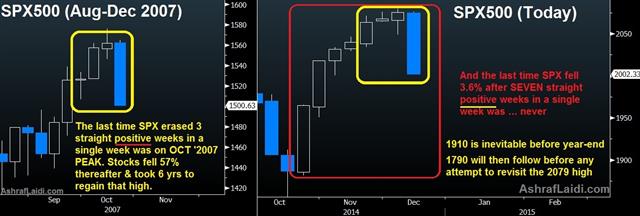
Much was written about this week's equity selloff, being the biggest drop since Sep 2011 etc. But two additional pieces of analysis we uncovered is that this week's 3.6% decline in the S&P500 single-handedly erased all of the prior 3 weeks' BACK-to-BACK GAINS. The last time this had happened was the week after the October 2007 record. Guess what stocks did after that... A more dangerous finding is that this week's S&P5 500 decline took place after SEVEN weekly consecutive gains, which was NEVER seen before in the index. I will post in Monday's Premium Insights new trades to exploit these developments.

More Hot-Charts
-

Mystery Charts
Feb 5, 2026 20:48 | by Ashraf Laidiسأرسل رسالة صوتية و كتابية توضيحية لأعضاء مجموعة الواتساب الخاصة حول هذه المخططات Will send detailed note on latest parameters to our WhatsApp Bdcst Group... -

2hr Gold Chart
Feb 3, 2026 13:09 | by Ashraf Laidiسأرسل رسالة صوتية و كتابية توضيحية لأعضاء مجموعة الواتساب الخاصة حول هذه المخططات Will send detailed note on latest parameters to our WhatsApp Bdcst Group... -

Gold Net Longs
Feb 2, 2026 17:16 | by Ashraf LaidiI really dislike after-the-fact analysis, but looking at this chart of Gold speculative net longs at the Comex, it shows speculators began lightening their longs on Jan 23.


