Hot-Charts
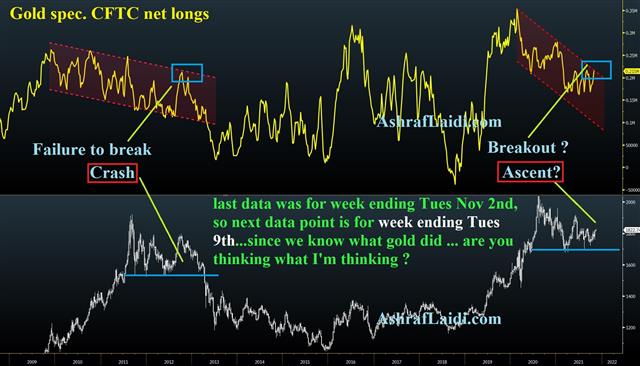
Upcoming Breakout in Gold Longs?
by
Nov 8, 2021 17:05
We know that Gold's commitment reports from the Comex is for the trading working period ending in a Tuesday. The last data point in the yellow graph is for the week ending last Tues (Nov 2nd), so the next data point (due this Friday Nov 12th at 15:15 Eastern 20:15 GMT) is for the week ending Tues 9th. Since we know what happened to gold over the last 6 days, the next data point will likely show a breakout in net longs. For more background, see a recent video about net Comex commitments.
Click To Enlarge
Click To Enlarge

More Hot-Charts
-

Mystery Charts
Feb 5, 2026 20:48 | by Ashraf Laidiسأرسل رسالة صوتية و كتابية توضيحية لأعضاء مجموعة الواتساب الخاصة حول هذه المخططات Will send detailed note on latest parameters to our WhatsApp Bdcst Group... -

2hr Gold Chart
Feb 3, 2026 13:09 | by Ashraf Laidiسأرسل رسالة صوتية و كتابية توضيحية لأعضاء مجموعة الواتساب الخاصة حول هذه المخططات Will send detailed note on latest parameters to our WhatsApp Bdcst Group... -

Gold Net Longs
Feb 2, 2026 17:16 | by Ashraf LaidiI really dislike after-the-fact analysis, but looking at this chart of Gold speculative net longs at the Comex, it shows speculators began lightening their longs on Jan 23.


