USDJPY Strategy and Yield Curve Analysis

by Ashraf Laidi
Oct 16, 2008 23:06 | 12 Comments

Violent volatility maintains its daily routine of aggressive swings, as US equities close 5% higher after more than a 9% decline yesterday, dragging risk appetite and currencies along with them. Wednesdays trading session saw a short-lived attempt for economic reports to reassert their dominance on financial markets before risk took over on Thursday. Market players were astounded by the fact that neither the 34-year lows in US industrial production, nor 18-year lows in the Philadelphia Fed index nor the record lows in the US National Association of Homebuilders index dipping managed to bring down US stocks. Consequently, currency traders shrugged off the fundamental reports and sought to trade in the tune of swinging risk aversion. Todays turnaround in US equities propped partly by a decline in interbank rates and modest stabilization in global credit markets.

USDJPY To Fail 103 Retest

We turn our focus to the hourly chart of USDJPY, which is displaying a familiar pattern of short-lived rebounds. The pair is testing the 101.50-55 resistance we indicated in our morning note, and will likely extend momentum towards the trend line resistance of 102 thanks to the impact of todays Wall Street rally on Asian trade. But with the deepening erosion in the real economy echoing across the different sectors, traders may not extend the current pick up in risk appetite past the 103 level, which presents the 61.8% retracement of the decline from 106.11 high to the 97.84 low. A break of 103 will have to test 103.75, but failure to breach above 103 is likely to be accompanied by the next trigger of risk aversion, sending back the pair back towards 101.20 and 99.00.
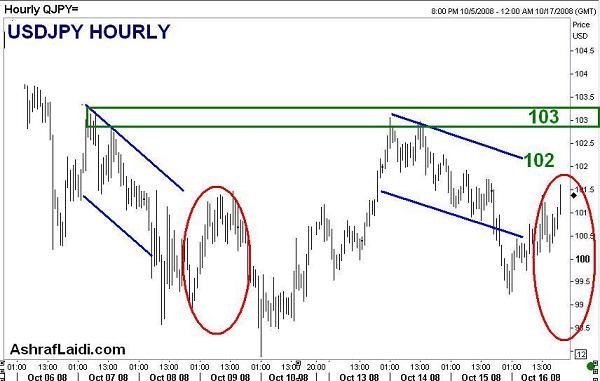
USDJPY Strategy and Yield Curve Analysis - Usdjpyhourlyoct08 (Chart 1)

The Message from Global Yield Curves

The chart below shows the steepness of the US, Eurozone and UK yield curves as measured by the difference between yields on 10- and 2-year government yields, known as the 10-2 spread. Steepening yield curves or rising spreads reflect plummeting 2-year yields relative to 10-year yields, hence, an expectation for further declines in the benchmark target of short-term interest rates i.e. the overnight interest rates set by central banks. US, UK and EU curves are steepening to their highest levels in four, five and three years, with the highest showing the greatest probability for central bank easing and the lowest suggesting the least probability for incoming rate cuts. This is in synch with the markets expectations for the Bank of England being the most likely to deliver the most in rate cuts and the European Central Bank the least likely to do so in the next 2 months. For a more detailed analysis of the forex implications of diverse yield curves shapes, explore Chapters 6 and 9 of my book "Currency Trading & Intermarket Analysis" now available for order online.
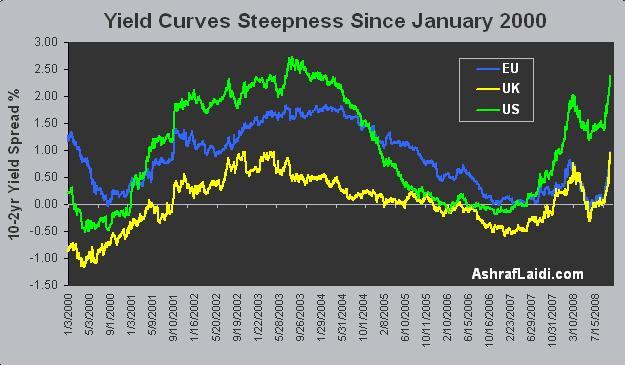
USDJPY Strategy and Yield Curve Analysis - Yldcurvesoct08 (Chart 2)

Comments (Showing latest 10 of 12) View All Comments
Ashraf Laidi
London, UK
Posts: 0
16 years ago
Oct 22, 2008 6:04
Steve, Aussie was propped by higher than expected Q3 CPI figures up 1.3% from 1.5% in Q2 and year on year rate rose to 7-year high of 5.0% so that boosted Aussie but it didnt prevent the currency from falling against the dollar as did all other higher yielders. Cable remains the big short vs USD after those comments from King.
Steve
New York, United States
Posted Anonymously
16 years ago
Oct 22, 2008 5:09
Ashraf,

I have been making money shorting usd/jpy, gbp/usd, eur/usd, thanks to your insight.

This aud/usd is very disappointing, is there life in this pair - aud/usd? Looks like dying. Your thoughts pls. I long 2 orders of aud/usd, losing money, dont know if I should cut loss. Thanks.
Ashraf Laidi
London, UK
Posts: 0
16 years ago
Oct 21, 2008 22:02
Tim, yen is strong due rising risk aversion (falling risk appetite) which drives flows outr of high yielding currencies and into lower yielding currencies such as JPY and USD. It is very important to understand this concept in this environment. This has been single most important dynamic of the past 2 years.

Ive explained risk appetite in detail all over this site, as well as in CHAPTER 5 of my book "Risk Appetite in the Markets", where I use illustrations showing relationship between stocks, VIX, JPY and the higher yielding currencies such as AUD, NZD and GBP. I repeat, if you want to make money in this forex market, you must grasp the concept of Forex and risk appetite. My book is the first ever book to devote a detailed chapter on this. Chapter 5.http://www.ashraflaidi.com/book/
Tim
California, United States
Posted Anonymously
16 years ago
Oct 21, 2008 21:12
Ashraf,
Why is the Yen so strong?
Maybe you've explained it elsewhere and links are ok
Many thanks. Great work!

Tim
Ashraf Laidi
London, UK
Posts: 0
16 years ago
Oct 20, 2008 23:46
Steve,

0.76 seems a decent resistance for AUDUSD as far as best case scenario. Yesterday's Aussie PPi data means tomorrow night's CPI data will be also on the high side and further push Aussie higher. Absent any aggressive seling in Wall St on Tuesday, we may see 0.75 after tomrrow's CPI release.
Steve
New York, United States
Posted Anonymously
16 years ago
Oct 20, 2008 19:46
Ashraf,

What is the upmove target for AUD/USD? 1.76 area? Thanks.
Ashraf Laidi
London, UK
Posts: 0
16 years ago
Oct 20, 2008 11:18
Ken, please contact me at ashraf@ashraflaidi.com
Ken
Sydney, Australia
Posted Anonymously
16 years ago
Oct 20, 2008 5:26
Looking forward to buy your decent book on Dec 15.

BTW, I have asked CMC Markets in Australia but they can only provide your "delayed" daily commentary due to the time lag. How to have your "real-time" commentary? Should I go to UK CMC London headquarters?
Ashraf Laidi
London, UK
Posts: 0
16 years ago
Oct 18, 2008 19:51
Steve,
Yes, prices could RISE towards those resistance levels then are likely to fail. As for the possibility that prices will drop from current level without extending higher to those resistance targets, it is less probable. We'll have to see how sentiment develops early next week. Just say tuned.

As for your statement that I have been "providing free advice all the time after CMC", I am still with CMC. I will be joining our London headquarters in early November, so CMC clients can still receive my analysis. Also, the advice on this site may have been free but it is adhoc, meaning it covers one particular pair or another, and NOT all of them on a daily basis.

At any rate, for all those who have been appreciating these analysis, all of it is covered in bigger detail in my book (gold-oil ratio, yield curve analysis to help you read forex and central banks and carry trades). There's also an extensive section on the dollar and stock market cycles during years of pesidential elections and following elections. The book is due out on Dec 15 but you can pre-order it today at a discount from Amazon by clicking on the book section in this site.

Ashraf


Ashraf Laidi
London, UK
Posts: 0
16 years ago
Oct 18, 2008 19:38
Hi Ken, thanks for your kind words. By becoming a CMC client, you'll be able to obtain my analysis on a daily basis, rather than twice per week as from my website. Since you're based in Australia, here's how to be a CMC client there. http://www.cmcmarkets.com.au/?region=Sydney

Ashraf