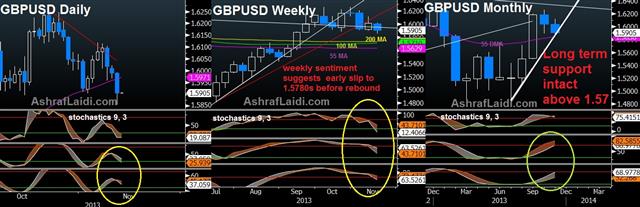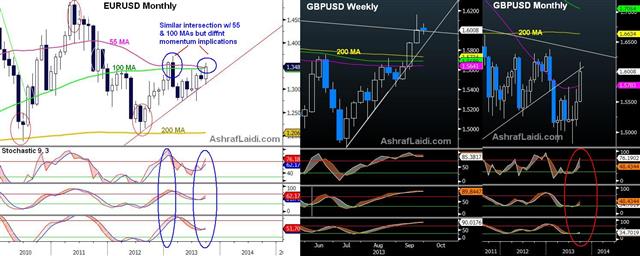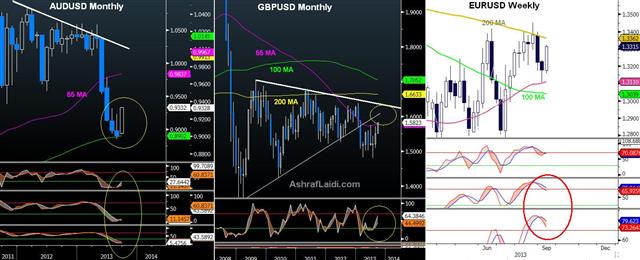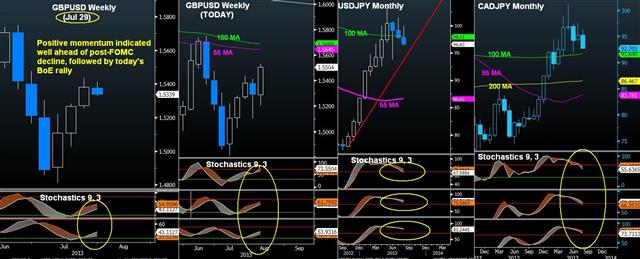


5 GBPUSD Technical Cases Since July 10
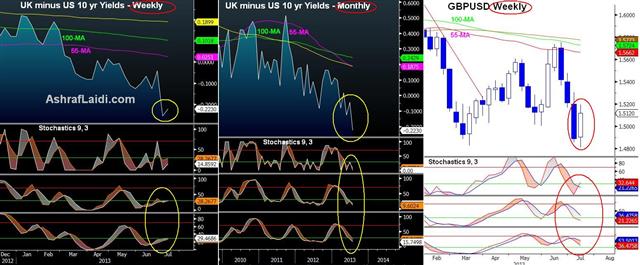
Sterling GBP is the currency that many love to hate and get it wrong as they repetitively call for its decline. The technical arguments for remaining long GBPUSD since June have been reiterated to our Premium clients. In sum, those technical factors have been persistent positive momentum on the weekly and monthly charts, which overrode the periodic noise and declines in late August, early October and early November. These analysis have proven that multi-time frame indicators (oscillators) are crucial in commanding the longer-term price view, which supercedes the sole use of price-driven indicators (candlestick and bar patterns). We post 5 examples of charts shown since July, making the technical case for going long GBPUSD. These charts were issued to our Premium Insights subscribers with fundamental and technical rationale. Today, we show only the charts to illustrate the winning technical set-ups for GBPUSD since mid July. Nov 12 Charts Sep 24 Chart Sep 11 Charts Aug 7 Charts Jul 11 Charts
Latest IMTs
-
Nasdaq Beware
by Ashraf Laidi | Jul 17, 2026 11:46
-
Intraday Gold Fibonacci
by Ashraf Laidi | Jul 16, 2026 13:19
-
Updating GoldBugs Ratio
by Ashraf Laidi | Jul 12, 2026 23:55
-
4 out of 4 Success Model
by Ashraf Laidi | Jul 10, 2026 10:10
-
Gold & Rate Hike Update
by Ashraf Laidi | Jul 6, 2026 18:48