7 Charts Ahead of Key Week
The yen is the only gainer versus the US dollar as indices drop back into the red on a combination of disappointing retail sales and industrial production figures from China and stronger than expected retail sales from the US. Interestingly, The Wednesday and Thursday sessions in US indices showed the smallest 2-day change in more than 3 months, highlighting the magnitude of the volatility since the Oct peak. The ECB managed to find some middle ground that signaled disappointment in the economy without hinting at any changes in policy, placing renewed pressure on the euro to hug the major 200-WMA. Ashraf sent me some charts to focus on ahead of Wednesday's Fed decision. More on this below.

We were watching for three things from the ECB: 1) An extension of forward guidance 2) a dovish tilt to the balance of risk 3) lower forecasts. Policymakers would have considered all three but they were in the tough spot because the optics of ending QE while shifting to a dovish stance were tough. In the end, Draghi left unchanged guidance about keeping rates on hold 'at least through the summer' for "an extended period" and opted to say the balance of risks was still balanced but that they were 'shifting to the downside'. Growth and inflation forecasts were shifted modestly lower.
Going forward this leaves Draghi the option of playing those cards if growth continues to disappoint. He emphasized that external factors -- namely trade -- were key drags.
The Charts
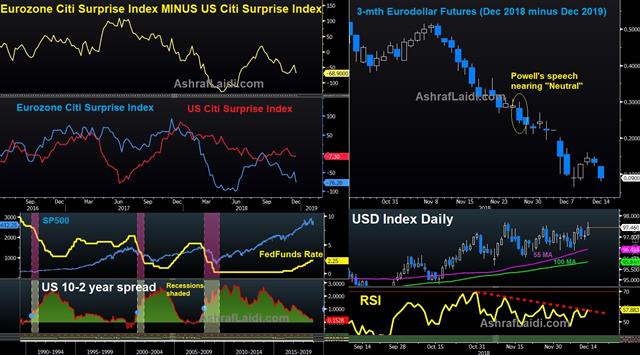
The charts above highlight a few things: i) the deterioration in economic data surprises for the Eurozone has been in place since August, while the peak for US positive surprises emerged in mid November, which is about the time the 3-month Eurodollar interest rate contract (upper right chart) peaked and started its decline -- falling chart denotes falling expectations of interest rate hikes.ii) The spread between the Dec 2018 and 2019 Eurodollar interest rate contract continues to suggest no rate hike for next year, raising the question on whether "interest rate futures have gone from pricing too many rate hikes for 2019 to pricing too few". This contrasts with the Fed funds futures, which continue to price a 72% chance for a rate hike next week.
iii) The 10-2 yield spread chart is a reminder that US recessions have occured at the start of the Fed rate cut campaigns since 1980s. The only exception was in autum 1998, when the Fed had to cut rates in the midst of the LTCM collapse and emerging markets crisis. Today, the equivalent of an emergency rate cut would be a surprise dissent against a December Fed hike, a dovish dot plot or a clear change in the FOMC policy statement. Ashraf is telling me that the real dovish surprise will come at Powell's Congressional testimony in February.
iv) The US dollar index has especially risen on broad weakness in GBP and CAD, while EUR has managed to hold on above the key 1.1290. The declining RSI in daily USDX is worth noting, but most importantly the USD/CNY and gold remain crucial signs of USD resistance.
| Act | Exp | Prev | GMT |
|---|---|---|---|
| Core Retail Sales (m/m) | |||
| 0.2% | 0.2% | 1.0% | Dec 14 13:30 |
Latest IMTs
-
Silver's Road to 102
by Ashraf Laidi | Jan 19, 2026 13:25
-
Avoid Yen Intervention Trap
by Ashraf Laidi | Jan 17, 2026 11:20
-
Winners & Losers
by Ashraf Laidi | Jan 15, 2026 16:22
-
Forecaster App التطبيق الذي كنت تنتظره
by Ashraf Laidi | Jan 15, 2026 13:55
-
Update on Gold & Silver after USSC
by Ashraf Laidi | Jan 14, 2026 19:54


