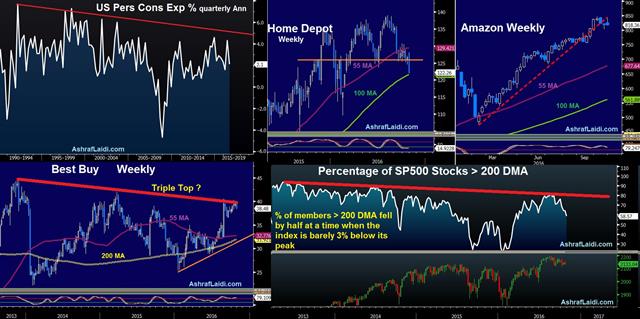
Charting Consumers after GDP
The 2.9% US GDP figure in Q3 was the highest since Q3 2014 mainly thanks to the biggest positive contribution from next exports in nearly 3 years and a surge in inventories replenishment. Since personal consumption expenditure more than halved in Q3 to 2.1%, excluding volatile inventories from the headline GDP report would show a 2.3% increase in final sales, lower than 2.6% in Q2 and well below the 8-year high of 4.7% attained in Q3 2014. For an economy to register robust growth mainly from a bump up in next exports raises concerns about the continuity of such positive source, especially when the consumer—long acting as the crucial source of growth is faltering. The evidence is in the charts below—Personal consumption expenditure, charts of the Americas' favourite retail stocks (Home Depot, Best Buy and Amazon) and finally weakening breadth in the all-important S&P500, showing the percentage of members trading above their 200-DMA fall by half when the index is only 3% below its record high. We let the charts do the talking. There are 4 existing trades in equity indices currently open in the Premium Insights.
| Act | Exp | Prev | GMT |
|---|---|---|---|
| Advance GDP (q/q) [P] | |||
| 2.9% | 2.5% | 1.4% | Oct 28 12:30 |
Latest IMTs
-
Gold Bear or Correction
by Ashraf Laidi | Oct 23, 2025 9:51
-
Gold Wave 3 تحديث موجات الذهب
by Ashraf Laidi | Sep 18, 2025 16:19
-
Forecaster App التطبيق الذي كنت تنتظره
by Ashraf Laidi | Jun 18, 2025 10:55
-
Updating GoldBugs تحديث مناجم الذهب
by Ashraf Laidi | Jun 16, 2025 13:58
-
Breaking Debt Ceiling & Forex Brokers
by Ashraf Laidi | Jun 6, 2025 17:33


