During a Losing Trade
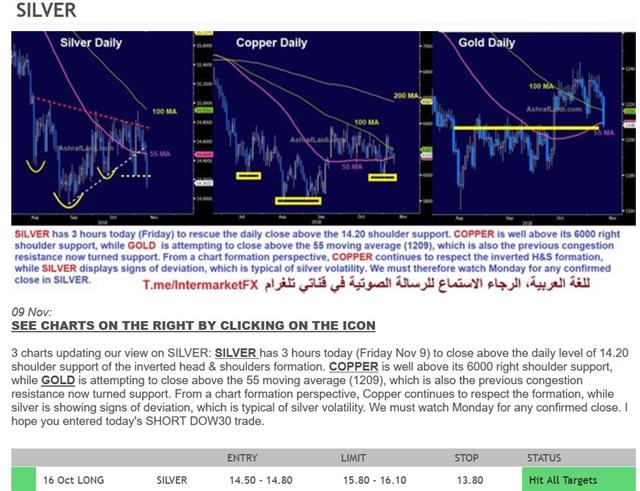
Here's an example of how proper inter-metal technical analysis can improve confidence during a losing trade. On Oct 16, we issued a LONG trade in silver for the Premium subscribers at 14.80 with the rationale that the impending inverted H&S formation was about to break above the neckline resistance. Well, it did not break it right away. Instead, silver continued to drop, extending towards the head (lows) of 13.96 over the ensuing 4 weeks. The stop remained at 13.80. So how did we manage the positon and thinking? (here's the snapshot of the trade below)

On Nov 9th (as the trade was deteriorating), I issued a trade update with 3 charts, highlighting my confidence in the silver long based on positive technical dynamics occurring in copper and gold, with each respecting key support levels. (Please see the text under the charts and feel free to look at your own charts for a better view). Gold remained above the trendline support from the Nov 14 lows and continued to chart a series of higher lows since the August lows, while copper continued to respect its right shoulder support. Some may say copper went on to break below the right shoulder later in early Jan and test the head (low). Yes, but by the time that occurred, silver was well off its low and gold remained above the Aug trendline support.
The message was crucial. Silver, being the smaller and relatively less liquid market was vulnerable to accelerating downside momentum, before gaining important support. A similar approach was applied to USDX vs EURUSD vs USDCNY. I long said in summer and autumn during the days of USD strength that only a break above 7.0 in USD/CNH would indicate the next leg-up in USD momentum and not EURUSD 1.11, USDJPY 115 or GBPUSD 1.26. Sometimes, it is invaluable to know where to look without moving the goal-posts too much.
Latest IMTs
-
Avoid Yen Intervention Trap
by Ashraf Laidi | Jan 17, 2026 11:20
-
Winners & Losers
by Ashraf Laidi | Jan 15, 2026 16:22
-
Forecaster App التطبيق الذي كنت تنتظره
by Ashraf Laidi | Jan 15, 2026 13:55
-
Update on Gold & Silver after USSC
by Ashraf Laidi | Jan 14, 2026 19:54
-
Gold Channel Intact
by Ashraf Laidi | Jan 12, 2026 20:58


