Intraday Market Thoughts
Metals vs Energy Before & After
by
Jan 6, 2023 12:43
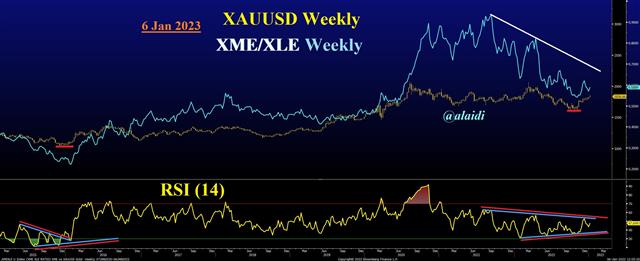
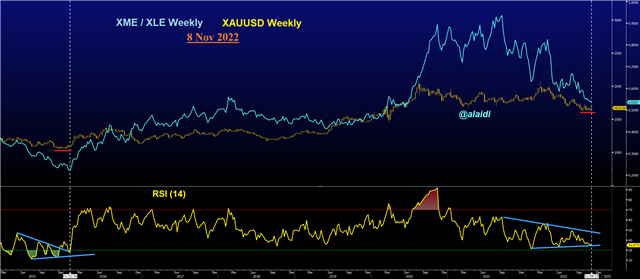
You all remember that chart of XME (Metals ETF) vs XLE (Energy ETF) I posted here on Nov 8th -- hours before Gold jumped $20 to break above $1700 and never look back. Yes, 2 hrs after the chart was posted, gold broke (and stayed) above $1700 ever since. Below is the updated chart (today) and below that is the original chart from Nov 8. What do you notice? The advancing RSI went on to test its trendline resistance and is setting to do so again. Why do I bother to chart metals vs energy? The best way to illustrate a strengthening market is to compare it to another robust/rising market...otherwise what's the point? And if inflation slows futher, what would you think happens to the battle between metals and energy?
Today's chart
Click To Enlarge

Same chart 2 months ago
Click To Enlarge

Latest IMTs
-
Beware of US Supreme Court Ruling on Tariffs
by Ashraf Laidi | Jan 8, 2026 19:38
-
Falling to 11 Percent
by Ashraf Laidi | Jan 7, 2026 20:28
-
Dollar Cannot Wait for Q1 to End
by Ashraf Laidi | Jan 6, 2026 12:40
-
Silver's Signal to Gold Full Explanation
by Ashraf Laidi | Dec 30, 2025 20:04
-
Gold Silver Next الذهب و الفضة
by Ashraf Laidi | Dec 26, 2025 17:15


