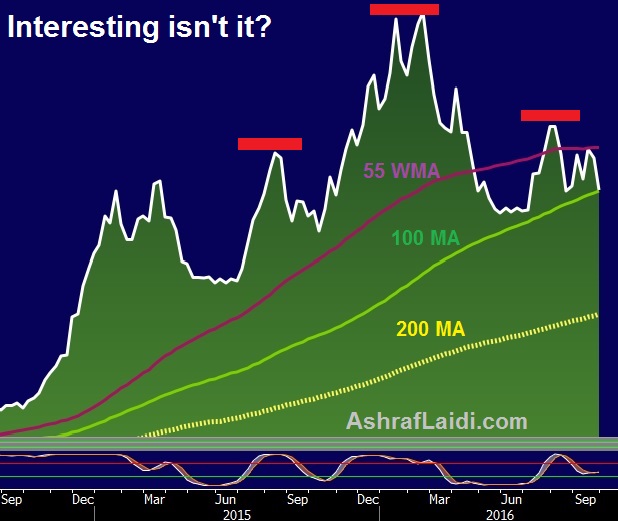
Quarter-End & Mystery Chart
The chart below appears to be making a Head-&-Shoulder formation. It is the weekly chart of an intermarket ratio. A new trade has been issued today with a 10-minute Video for Premium subscribers, supporting the technical argument for the trade, while challenging the validity of the chart. The problem with ratio charts is that of exaggerated moves, which may provide false charting formations.

Q3 ended with the Aussie and Kiwi as the top performing currencies and GBP being the worst, followed by the CAD. Palladium was the best performing commodity of the quarter, followed by sugar and cotton. The worst commodities of the quarter were soybeans, wheat and corn.
The Hang Seng Index was the top performing global index of the quarter up 10.6%, followed by the NASDAQ (+10.2%), DAX (+7.5%), FTSE (+6.1%), Nikkei (+4.9%), Eurostoxx (+4.1%) and SPX (+3.1%).
Q4 will witness a volatile US presidential election, followed by heightened noise from Fed speakers asserting what should be done with rates in December. Meanwhile, there are 9 Premium trades in progress, including the trade issued earlier this afternoon.
Latest IMTs
-
Falling to 11 Percent
by Ashraf Laidi | Jan 7, 2026 20:28
-
Dollar Cannot Wait for Q1 to End
by Ashraf Laidi | Jan 6, 2026 12:40
-
Silver's Signal to Gold Full Explanation
by Ashraf Laidi | Dec 30, 2025 20:04
-
Gold Silver Next الذهب و الفضة
by Ashraf Laidi | Dec 26, 2025 17:15
-
Everyone's Talking about this Risk
by Ashraf Laidi | Dec 24, 2025 14:08


