



Recurring USD Pattern 18 Months Later
Trump's latest announcement to impose tariffs on 10% of Chinese exports started off with a risk-off reaction in Asian trade before markets stabilized on the rationalisation that traders had been expecting levies of as high as 20%. The USD reaction to tariffs-related announcements remains largely driven by the initial reaction in equity indices, with the yen relationship being the most consistent in FX. Combining the Trade War factor (Offsetting CNY to US tariffs) with that of the Fed question (how high can they raise rates despite signs of peaking inflation) and the emerging market predicament (how high can the USD rally when EM repay USD-debt) and you end up with a blurry (contradictory) picture for the US dollar.
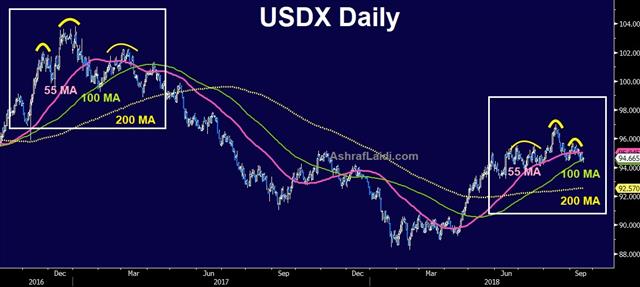
Alternatively, you could refer to the above daily chart of the USDX and assess the recurring pattern between price and moving averages interaction. Whether the 55-DMA shall cross below the 100-DMA as it did 18 months ago following the right shoulder failure remains to be seen. Yet, what does it mean for EURUSD? Yesterday, I argued for invalidating a long-term head-&-shoulders formation in favour of a more pressing and immediate technical development. The argument is further supported when factoring USDX into the individual USD pairs. The full video for Premium subscribers can be found here.
Latest IMTs
-
Nasdaq Beware
by Ashraf Laidi | Jul 17, 2026 11:46
-
Intraday Gold Fibonacci
by Ashraf Laidi | Jul 16, 2026 13:19
-
Updating GoldBugs Ratio
by Ashraf Laidi | Jul 12, 2026 23:55
-
4 out of 4 Success Model
by Ashraf Laidi | Jul 10, 2026 10:10
-
Gold & Rate Hike Update
by Ashraf Laidi | Jul 6, 2026 18:48