VIX, Oil, BRICS & Sterling's Sell-Appeal
Just when we started highlighting the case for peaking risk appetite in last week's article, oil prices picked up the mantle for the bulls and triggered the sell USD, buy risk trade, partly caused by a plunge in weekly crude oil inventories. The previously unimaginable break above $74 per barrel has taken place this week, courtesy of growth optimism from better than expected Eurozone PMI figures and the 4th straight monthly increase in US existing home sales. But with currencies such as GBP and CAD solely rallying on the USD-side of the equation, their secular lack of fundamental strength has led to rapid reversals off their highs. FX markets are reluctant to retain any gains in risk currencies (currencies with high positive correlation with equities such as GBP, CAD, AUD and EUR).
Market participants are increasingly aware that intermittent bouts of risk appetite remain largely driven by inventory-related price jumps in oil rather than signs of improved demand or upside economic surprises. Consequentially, energy-related members of major equity indices have dominated the advancers.
Oil's Resistance & VIX Support
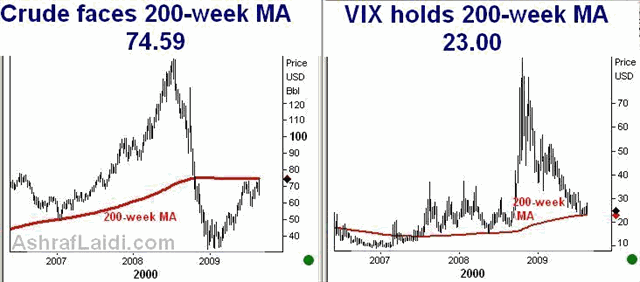
But with equities dealing a powerful Friday blow to the bears by hitting fresh highs for the year, we need to take a longer perspective for the general pulse of risk appetite, looking for any red flags lurking in the technical horizon. The charts below show $74.59 on oil and 23.00 on the VIX both mark their respective 200-week moving averages, thereby, serving as the underpinnings of any limitations in prolonged risk appetite. The almost perfectly horizontal shape of the oils 200-week MA manifests a relatively flat trend, which also suggests a mean-reverting trend for the fuel.
These long term measures of volatility and crude are especially vital for gauging the next destination in strengthening appetite, especially after the S&P500 closed the day at 1,026, well above the 1,014 resistance, which is the 38% retracement of the decline from the all time high of October 2007 to the 12-year low of March 2009. And so lets keep a close watch on these two levels in crude and the VIX.

BRICS Meet Mr. Fibonacci
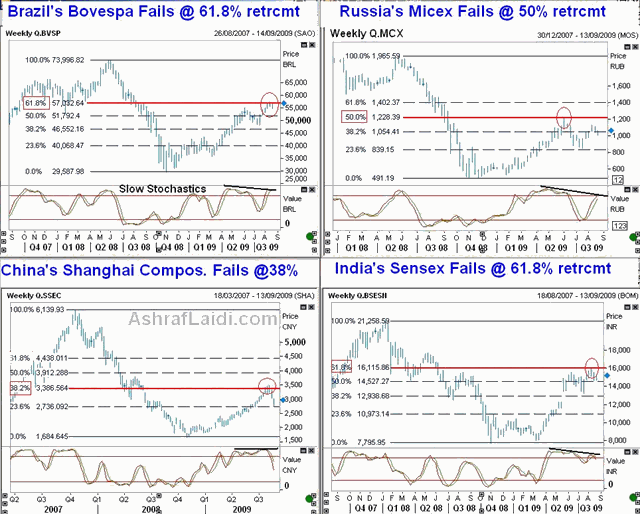
While the Shanghai Composite Index has finally become a household item among individual investors and the media following its 17% slump off its record highs, we first warned of this unsustainable price action on July 29th, when the index fell 5% before peaking 4 days later . The chart in the lower left quadrant below shows how the SSEC peaked at the red horizontal line38% retracement of the decline from the all time high of 2007 to the low of 2008. The other 3 charts show how the main equity indices of other 3 BRICs members; Brazils Bovespa, Russias Micex and Indias Sensex, each of which saw its 8-9 month rally stall at key Fibonacci retracement levels. Other than respecting major retracement resistance levels, these high profile emerging market members could be at risk of sustaining further blows later in the quarter owing to the declining weekly stochastics, spelling double bearish divergence. The currency impact of these indices is their allocation of risk cash, which is largely mobilized away from USD and JPY. Thus, rising BRICS is increasingly synonymous with strengthening EUR, GBP, AUD, CAD and NZD

Sterling's "Sell Appeal"
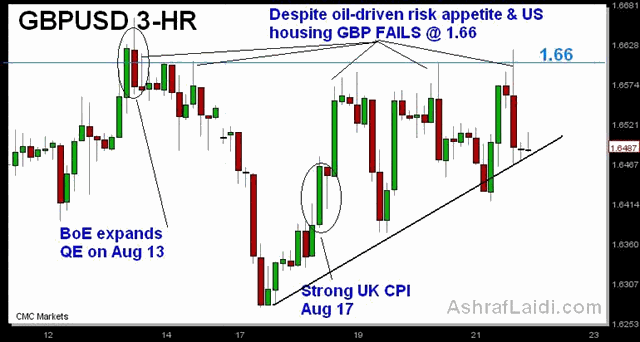
While our secular bearish view on the US dollar remains intact, we find more downside in the British pound against USD, and JPY over the medium term (into early Q4). Since pointing out last week the importance for GBPUSD to hold above its 50-day MA in the face of the headwinds from a dovish Bank of England, the pair has increasingly shown extreme signs of toppishness. The 3-hour chart below highlights how the bears are dominating the flow and any bounce towards $1.66 quickly becomes prey for the bears. Whether we get a fersh round of negative UK data, oil backs off its 200-week moving average or/and the VIX further pushes off its 200-week average, GBP will be due to retest $1.6280, before the targetting $1.57.


