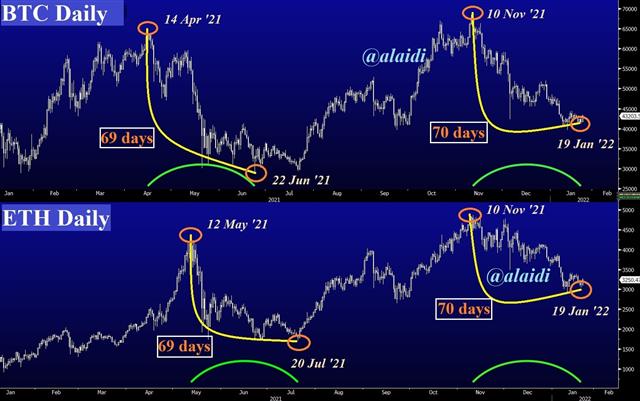
69 days vs 70 days
You've already watched this week's video on 11-week cycles in Bitcoin and Ethereum. The daily version of those cycles is in the below chart, showing 69 days last year and 70 days in the latest downcycle. Combining today's rally in BTC and ETH with the SPX recovery above its 100-DMA seems like a powerful technical confluence for the bulls. Buy-the-dip justification may grow stronger when adding Nasdaq's bounce from its 10% top-to-bottom decline. All this sounds great, but more obstacles remain ahead. US 10-year yields having broken above their 200-week MA, such occurence could be similar to the break of Nov 2016, when higher yields made their presence felt in tech stocks. Let's keep an eye on the following levels of confluence; 4550 on SPX 40K on BTC and please rewatch the role of indices alongside crypto cycles after 1:30 mins of the video.

Latest IMTs
-
Gold or Silver?
by Ashraf Laidi | Jan 23, 2026 17:42
-
40 on the Mint Ratio
by Ashraf Laidi | Jan 23, 2026 11:27
-
Trump's Golden Hit
by Ashraf Laidi | Jan 22, 2026 10:58
-
4890 Hit, Now What?
by Ashraf Laidi | Jan 21, 2026 11:34
-
Gold 4850 No Change
by Ashraf Laidi | Jan 20, 2026 9:48


