Intraday Market Thoughts Archives
Displaying results for week of Jan 10, 2016VIX Asleep, Fears Awakens
One notable reason the VIX is trading at only half the level seen in August (53.0), a time when equity indices plunged near today's levels is related to market's absorption of risk versus macro negatives. But here are 4 metrics with more relevance and urgency than the oft mentioned fear index. Full Article.
The Great Commodity Divide
The global economy has been divided along emerging and developed market lines for the past 15 years. Now there is a line and offers a clearer way to view what's underway in 2016. There are currently 5 trades open in the Premium Insights, 3 of which are GBP related. More equity indices trades will be included next week, tactically leading the month's meetings of the ECB, BoC and the Fed.
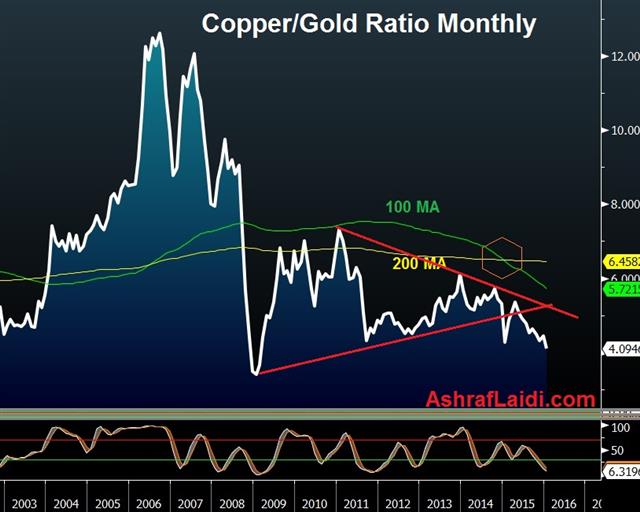
The inclination is to blame the United States, the Eurozone or China for any major market developments and in general that's proven true. Alternatively, 'emerging markets' often get the blame.
The market driver at the moment is none of them, nor is it Japan. It's commodities. The four largest economies are facing various challenges and slowing growth but there is no obvious crisis unfolding.
The divide that matters in the global economy right now is 'commodity extractors' versus 'commodity consumers' and it helps to explain how none of the usual suspects are flashing warnings signs but markets are in disarray.
Any single commodity exporter is a small factor in the global economy. The largest is Brazil and its economy is just a quarter the size of China. Add in fellow exporters like Canada, Australia, Mexico, Indonesia and Saudi Arabia and they equal size of China's GDP. Include other exporters in Africa, the Middle East and Latin America and they equal the United States.
The commodity crash is hitting all those countries hard along with the multitude of over-leveraged companies in the resource industry.
The sensitivity is high at the moment. The Canadian dollar was down for a record tenth consecutive day on Thursday. Even in a situation like an oil rout and a central bank that could surprise with a rate cut, that may be too far, too fast.
On Thursday sentiment staged a recovery and in a rare divergence, the Australian dollar was the top performer.
The flipside of the commodity crash is that the commodity consuming countries will benefit from cheaper raw materials. At the moment, the rapid change is causing dislocations but as it unfolds in the year ahead, expect a continuing ebb and flow.
Knowing Risks Doesn’t Mean We Know The Downside
We have to circle back to the two major super-themes that are ongoing. Most important is the commodity collapse. Brent broke $30 today for the first time in 12 years after an early rally evaporated in moments after large unexpected builds in US gasoline and distillate supplies. Aussie jobs are due next (more detail below). There are currently 5 Premium trades crrently in progress. A new Premium video is out, recorded during the release of today's EIA curde inventories, highlighting the one-sided flow in commodities, FX and equities dictated by oil prices. Viewers of the video will detect the first Death Cross of its kind since January 2000 in the chart posted at 26:58 seconds of the 30 mins video.
We have witnessed a 15-year bull market in commodities. It's been 25-years since there was a true bust in resource prices. It's something most market participants have never seen or can't remember. A super-cycle deserves a super-bust and that's the underlying theme that's cutting the legs out of commodity-producing emerging markets and developed markets.
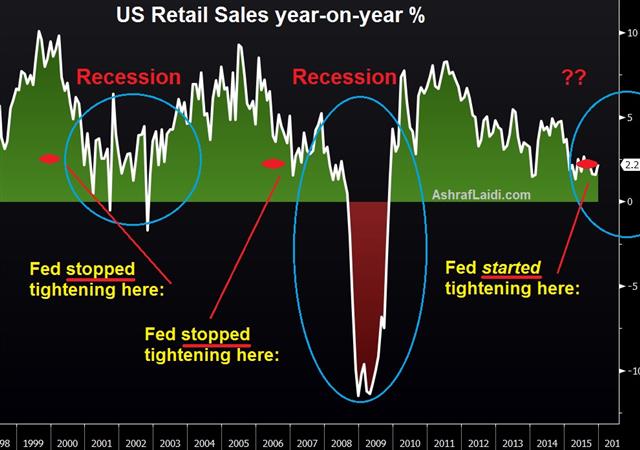
The second theme ties into the first. It's that markets have an overly US-centric view and that includes the Fed. The Fed's models underestimate how intertwined global markets are and the potential for the commodity bust to infect and damage the global economy. They may also underestimate how at risk the bond market is to the double-whammy of higher rates and collapsing resource prices.
One of the events that got almost no attention on Tuesday was a note from Moody's where they forecast the default rate on high yield bonds will rise to 4.4% from 3.2%. Moody's subsequently cut $15B of Duke Energy bonds. It's not only oil as S&P downgraded Tata Steel as well. More downgrades are undoubtedly coming.
The interaction between the commodity collapse, bond market default risk and global central banks is the ultimate theme and right now we're seeing a vote of no confidence. That's why the pain could continue.
The economic data in a situation like that is always the laggard. That will be true in Australia where jobs numbers have continued to show robust hiring. The December report is due at 0030 GMT and expected to show a decline of 10K jobs and unemployment rising to 5.9% from 5.8%. Keep an eye on the full-time/part-time breakdown.
Look for trading opportunities in a downward skew. An strong number will only give the Aussie a small boost while weak data could lead to another harsh decline.
| Act | Exp | Prev | GMT |
|---|---|---|---|
| Employment Change s.a. (DEC) | |||
| -12.5K | 71.4K | Jan 14 0:30 | |
| Fulltime employment (DEC) | |||
| 41.6K | Jan 14 0:30 | ||
| Part-time employment (DEC) | |||
| 29.7K | Jan 14 0:30 | ||
| Unemployment Rate s.a. (DEC) | |||
| 5.9% | 5.8% | Jan 14 0:30 | |
Cable Below 1.44, China Trade Looms
The pound fell to a five year low after weak industrial production added to the downtrend. The yen was the top performer while the commodity currencies lagged wit GBP. The razor-sharp focus on China will continue with trade data due later. A new Premium Trade has been issued an hour ago, involving GBP.
فيديو الاسبوع تحليل آخر التوصيات و شرح ديناميكيات العملة الصينية، النفط و مؤشر تداول و دبي
UK industrial production fell a surprise 0.7% in November, much worse than the flat reading expected. The majority of the 750 pip decline in cable over the past month has come on less-hawkish BOE signals and broad USD strength but a softening economy could be a fresh reason to sell.
After a fall as low as 1.4350 cable appeared to find some demand as it bounced 90 pips. The turnaround is the first good signal for the pair since December but it's very early for any optimism.
One place where there is virtually no optimism left is the oil market as it briefly broke $30 in a fall to fresh 12-year lows. The fall from $38 in late December has no doubt left oil executives in dire situation. After seven days of declines and a steady drumbeat of negativity, there may be room for a short-term bounce to $34.
Broader sentiment has begun to stabilize and US stocks rallied late to finish 0.8% higher.
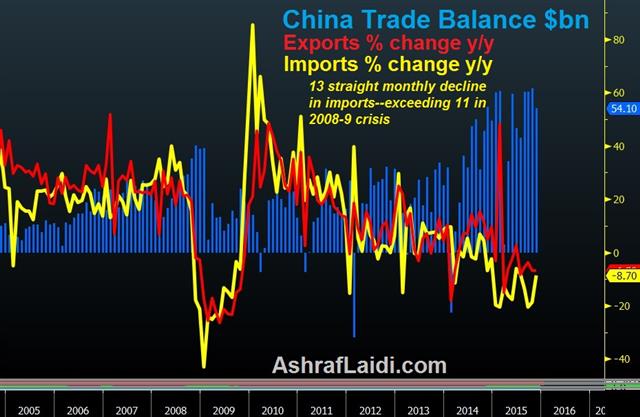
The economic highlight of Asia-Pacific trading comes at 0200 GMT when China reveals trade data for December. The trade balance is expected at +338.8B yuan but the relative rise in imports and exports is a much more important barometer of economic health.
The consensus is for a 4.1% y/y decline in exports, accelerating from 3.7% in Nov. Imports are forecast to tumble 7.9% y/y, from -5.6% in Nov. Chinese importers are at the front end of the global manufacturing cycle and a swift fall reflects a poor domestic and global economy.
At the same time, the US State of the Union speech will begin. President Obama is largely sidelined by Congress on economic issues so he may focus on foreign policy and there is a small chance it could affect oil.
Another spot that's getting buzz is the spectacular rise in offshore yuan lending rates. The Hong Kong Interbank Offer Rate or HIBOR has risen to a record 66.8% from 4% late last week as the PBOC aims to crush yuan speculation.
| Act | Exp | Prev | GMT |
|---|---|---|---|
| Trade Balance (DEC) | |||
| $53.0B | $54.1B | Jan 13 2:00 | |
| Imports (DEC) (y/y) | |||
| -11.5% | -8.7% | Jan 13 2:00 | |
| Exports (DEC) (y/y) | |||
| -8.0% | -6.8% | Jan 13 2:00 | |
| Federal Reserve Bank of Boston President Rosengren Speech | |||
| Jan 13 13:00 | |||
| Fed's Evans Speech | |||
| Jan 13 17:30 | |||
| BOE's Governor Carney speech | |||
| Jan 13 16:15 | |||
Offshore Yuan Surges, Lockhart Hedges
A rally in the offshore yuan virtually unwound all the declines in 2016 but markets remained tentative until a Fed official hinted at no rate hikes in Q1. The Australian dollar was the top performer while the Swiss franc lagged. Japan returned from holiday with further rise in the current account surplus. In the Premium Insights, CADJPY short was closed at 82.77 yen from the 85.30 entry, locking in a profit of 253 pips. The cross will be revisited for possible re-entry.
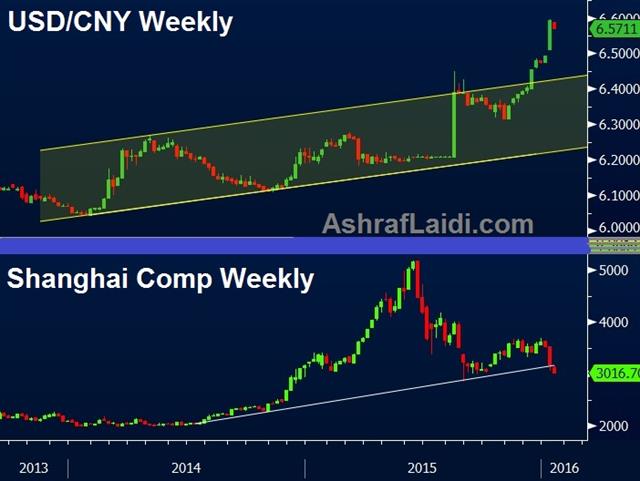
The 0115 GMT yuan fixing is likely to be stronger today after the onshore CNY rose slightly and the offshore CNH surged the most since the free(er) float was introduced. A sharp drop in USD/CNH realigned the two after the IMF criticized the gap on the weekend. The shift sets the stage for a lower fix today and may be an effort to reign in volatility.
In the broader sense, markets also took a small step towards calm on Monday. The yen underperformed, bonds slide and the S&P 500 finished marginally higher. Sentiment improved after Atlanta's Fed's Lockhart said the Fed wants to see rising inflation before hiking and might not learn much more about before the mid-March FOMC meeting. It's the first small step away from the 3-4 hike blueprint the Fed has roughly outlined as a 'gradual' tightening.
Canada oil below $17
While some markets were more calm, the oil markets remains in flux. An early bounced turned into heavy selling as crude fell to a fresh 12 year low below $31 per barrel. Canadian oil is now trading at just $17 and it's no surprise the loonie is also at 12-year lows.
At 0600 GMT, the Japanese ecowatchers survey for the currently lookout is expected at 46.6 from 46.1
| Act | Exp | Prev | GMT |
|---|---|---|---|
| Current Account n.s.a. (NOV) | |||
| ¥1,143.5B | ¥858.5B | ¥1,458.4B | Jan 11 23:50 |
China CPI Leaves Room For Action
Modest Chinese inflation left room for a rate cut but the PBOC stayed on the sidelines on the weekend. Markets were severely roiled last week and finished at the extremes, we survey some of the damage. The economic calendar is light in the Asia-Pacific region to start the week but there will be an intense focus on the yuan and Chinese stocks.
The Chinese Dec CPI rose 1.6% year-over-year in data released on the weekend. It matched the consensus estimate was slightly higher than the 1.5% y/y Nov reading. The PPI was down 5.9% y/y in a sign that inflation pressures remain on the downside.
In the past six weeks the state-sponsored Chinese press has had multiple rumours of PBOC action but none have come to fruition. Leaders are likely struggling with fears that action will be seen as a sign of desperation.
On Friday, the yuan fixing was slightly stronger to end a streak of eight consecutive declines. The improvement was a negligible 0.001 points in a signal that optics are now as important to the Chinese government as fundamentals.
The offshore yuan finished slightly weaker on the day and the onshore yuan fractionally higher but the gap between the two still favours a softer yuan at the 0115 GMT fix. Another time to highlight on the daily calendar is 1000 GMT to 1130 GMT. Within that time is the usual window of PBOC action on interest rates.
The question is: How will markets react? The answer might be that it depends on when it comes. A quarter-point rate cut with a reduction in the RRR would best be delivered after a few days of more-stable markets. That would diminish the chance that it's viewed as a panic move, like it was in August.
As markets re-open for the week, the focus will be on stocks. There will be some initial negative pressures after the weak finish in US stocks along with many weekend headlines emphasizing that it was the worst 5-day start in the S&P 500 ever.
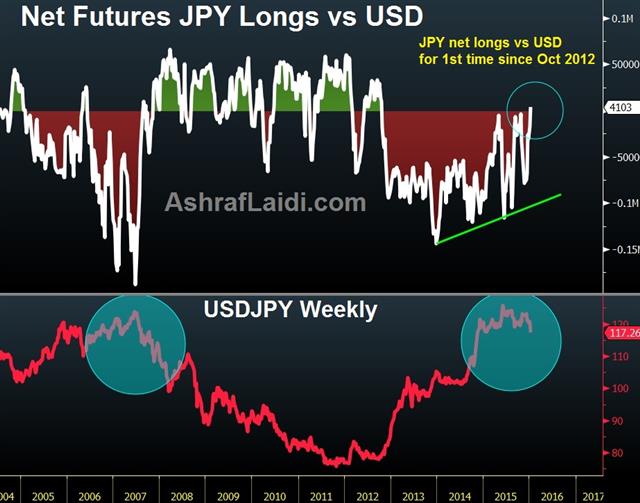
In FX, so far this year the worst performer is AUD/JPY, which is down nearly 7%. NZD/JPY is close behind while CAD/JPY is down 4.75% and even the USD is down 2.5% vs JPY.
Commitments of Traders
Speculative net futures trader positions as of the close on Tuesday. Net short denoted by - long by +.
EUR -161K vs -161K prior JPY +4K vs -17K prior GBP -30K vs -31K prior AUD -14K vs -18K prior CAD -60K vs -61K prior NZD -1.5K vs +0K prior
The strength in the yen to start the week was underscored by net yen positioning flipping to long for the first time since October 2012.


