Intraday Market Thoughts Archives
Displaying results for week of Aug 16, 2015Why it's worse than October 2014
Fed funds futures are coming around to the idea of no September rate hike, a position we long held since last December based on the argument that inflation in 2015 will move further below the Fed's mandate, to the extent that the tightening in labour markets is inadequate to stir up inflationary pressures.
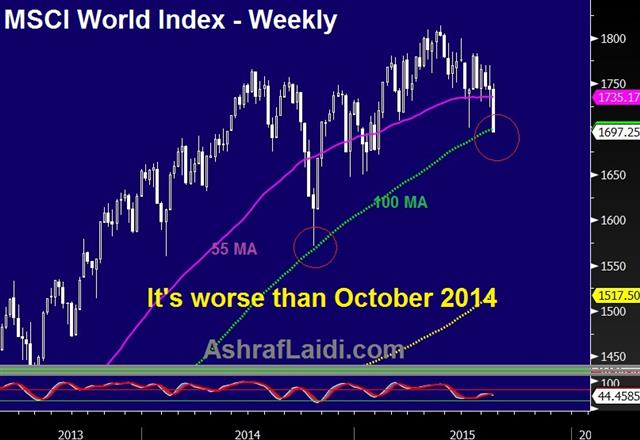
The negative trifecta of: i) slowing China; ii) strengthening US dollar; and iii) rising oil supplies has unleashed a negative feedback loop of accelerating descent in oil prices, gloomy climate for emerging market's exports to China and broadening cuts in capex from energy gains dwarfing any savings to US consumers from lower prices at the tank.
Why it's worse than the October 2014 sell-off?
Nearing Disinflation
Most market and survey-based measures of US inflation are lower than in October 2014. Unlike survey-based inflation measures, which are provided monthly, break-even rates priced off US inflation-protected bonds are available daily, with the 2-year BE tumbling near 7-month lows at 0.24% and 5-year BE rates at 1.2%, the lowest since 2010. Is the Fed being inadequately taking notice of falling oil prices? This WILL change in the September meeting and the first hint of which will be seen in next weekend's speech by Fed governor Stanley Fischer at the Jackson Hole conference.Greater USD Backlash
Since October, the USD has gained an additional 12% against most major currencies, exacerbating the currency translation effect for US multinationals and increasing the price for US exports in the global market place. Surging costs of USD-denominated loans are also punishing emerging markets, especially in Asia. More than $900 bln in USD-denominated debt remain unpaid in corporate China.No Extra BoJ, ECB Magic
Two weeks after global yields and share prices plummeted in midOctober, the Bank of Japan surprised the world with a rare split 5-4 decision in its policy board to accelerate the monthly purchases of Japanese government bonds so that its holdings increase at an annual pace of 80 trillion yen.Two weeks later, the European Central Bank signalled to markets that quantitative easing and negative interest rates would finally be pursued.
Markets' reaction to these events was a 2-month rally in global shares, which eventually stalled in January 2015 as the New Year gave its first hint of impending deflation.
China Devaluation = Antithesis of ECB, BoJ QEs
China today is far weaker than it has ever been over the last 15 years. Most services and manufacturing surveys indicate a contraction, while exports have declined for the 5th month over the last seven months, driving down currency reserves to two-year lows. Tying the yuan to the rising USD has worsened the situation since October.This month's CNY devaluation may be a stimulus for China, but its impact on the rest of the world is the antithesis of QEs from the BoC and ECB.
We raised the target on our EURUSD longs from Jul 30 (pre-NFP) as the unwinding of EUR shorts has yet to extend once a 2015 rate hike is completely shut out of the market. The euro unwinding is partly joined by further losses in the Eurostoxx and the Dax, with 9,970 and 1,830 targets cemented for the Dax-30 and S&P500.
TECHNICAL ADDENDUM:
90 minutes before the Friday close, it appears that the weekly charts in the S&P500 and Dow Jones Industriuals Average are already undergoing greater deterioration than in the week ending on October 17, 2014, when the S&P500 ended the week above its 55-week moving average, despite an intraweek plunge below the average. In contrast, today's S&P500 is highly unlikely to prevent a close above its 55-week MA. Only a close above 2051 would do so. Currently, it's trading around 2000. In the case of the DJIA, the index will surely close the week below the 100-WMA, unlike in October 17 when it closed well above the 100-WMA. Only a rebound back to 16,990 in the next 90 minutes would prevent that.The Question Now
Fed confusion manifests itself in a rush to the exits in crowded trades Thursday. The S&P 500 suffered its worst day since Feb 2014 and the euro led the way as the carry trade unwound. The Asia-Pacific calendar is quiet but PBOC rumors are circulating ahead of the weekend. Ashraf's Premium Insights went long EURUSD on Jul 29 at 1.1020 is now +200 pips in the green, while the EURAUD long of June 17 at 1.4690 is +600 pips in the money. Today, a new USD trade has been issued with the support of 3 charts.
Confusion is often worse for a market than good or bad news. Eventually uncertain market participants square up rather than trying to sort out competing headlines. The Fed is the major question mark but China, the US economy and the global economy are all in flux.
Thursday's price was representative of all the most crowded trades clearing out. Long stocks was hit by a 44- point, 2.1% decline in the S&P 500. Importantly, both the July and March lows were broken.
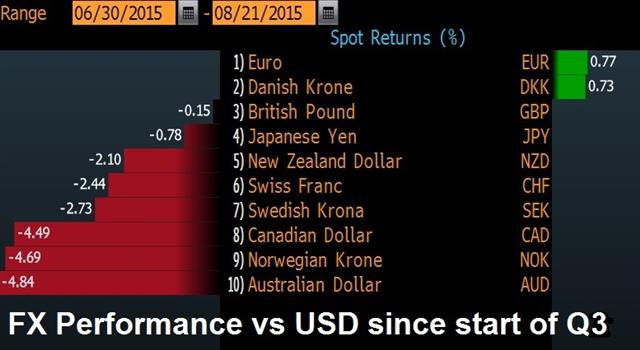
Short EUR is the most-crowded FX trade as billions of euros were borrowed and invested elsewhere. So it's no surprise that EUR/USD was the best performer in a rally to 1.1240 from as low as 1.1035 yesterday. EUR is the best performing currency out of 11 major currencies since the start of the month and the start of the quarter.
Commodities were also winner as oil rebounded 1% and that gave a boost to commodity FX. Safe havens were in demand, leading to rallies in gold and bonds.
The big question now is: What happens next? The Fed is still almost a month away.
It may yet be too soon for a sustained breakdown in markets although it's rare to get a reversal on a Friday. Economic data in the form of the Philly Fed, existing home sales and initial jobless claims Thursday were solid.
To stabilize, the market just needs a better hint that the Fed will wait before hiking. We look to Lockhart on Monday and Jackson Hole next Friday, discussed by Ashraf on here 3 weeks ago.
At the moment, the most-crowded trade of all is long US dollars but even Thursday's jitters barely shook it (where else do you go?) However, if a Fed hike comes off the table for 2015, the dollar will fall much further.
| Act | Exp | Prev | GMT |
|---|---|---|---|
| Existing Home Sales (JUL) (m/m) | |||
| 5.59M | 5.44M | 5.48M | Aug 20 14:00 |
| Existing Home Sales Change (JUL) (m/m) | |||
| 2.0% | -0.6% | 3.0% | Aug 20 14:00 |
| Initial Jobless Claims (AUG 14) | |||
| 277K | 272K | 273K | Aug 20 12:30 |
| Continuing Jobless Claims (AUG 7) | |||
| 2.254M | 2.265M | 2.278M | Aug 20 12:30 |
| Philadelphia Fed Manufacturing Survey (JUL) | |||
| 8.3 | 7.0 | 5.7 | Aug 20 14:00 |
US BreakEven Inflation at 5-Year Lows
Neither higher than expected Philly Fed survey at 8.3 in August nor a dovish set of FOMC minutes has managed to ease the onslaught of selling in global equities. The old trick that a dovish Fed and poor data are good for stocks is no longer valid. An uncertain Fed drove down chances of a Sept Fed hike to 36% from close to 50% earlier in the week. Meanhwile, stock indices deepen their selloffs well after a series of DeathCrosses emerged in the S&P500, Dow-30, Dax-30, FTSE-100 and Shanghai Composite. which may suggest that they require the Fed to firmly shut the door on any 2015 rate cut.
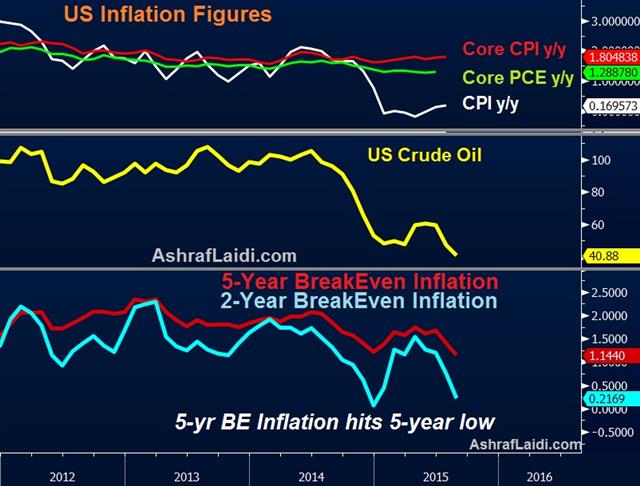
We highlighted earlier on the week that the real impact on CPI remained to be seen after the latest downleg in oil prices. 0.2% y/y in the headline and 1.8% y/y on the core underlines the divergence caused by falling oil prices. This was seen in yesterday's release of UK CPI.
Breakeven inflation at 5-year lows
The above charts suggest market-oriented measures of inflation, such as break-even rates, which measure the difference between traders' expectations of the difference between nominal bonds and inflation-protected bonds — have fallen sharply. Unlike survey-based inflation measures, which are provided monthly, break-even rates are available daily, with the 2-year BE tumbling to 7-month lows of 0.22% and 5-year BE rates at 1.1%, the lowest since August 2010.These inflation measures have been criticized for being too sensitive to oil prices. But is the Fed being inadequately aware of falling oil prices? We warned here about how the Fed could be behind the curve in accounting for energy's impact on inflation.
We continue to expect the Fed to remain on hold in 2015, a positon long held since December 2014 . Our longs in EURUSD pre-NFP at 1.1020 remain open and our final target will not be lowered for now.
| Act | Exp | Prev | GMT |
|---|---|---|---|
| Philadelphia Fed Manufacturing Survey (JUL) | |||
| 8.3 | 7.0 | 5.7 | Aug 20 14:00 |
Fed Hike on Thin Ice
We have been skeptical of the case for a Fed rate hike in September and after a soft inflation report and dovish Fed Minutes, the market is beginning to agree. The Swiss franc was the top performer in a flight to quality on Wednesday while the Canadian dollar lagged. The Asia-Pacific calendar is light but a Fed member will make a speech in Indonesia.

The chance of a hike rate fell from close to 50% to 36% in the rate derivatives market on the heels of two key releases Wednesday. First, core CPI rose just 0.1% m/m compared to 0.2% expected. Then the FOMC minutes said 'most' officials hadn't yet seen the conditions for a hike and that 'almost all' voters wanted to see improvements in jobs and growth before voting to hike.
A big question mark for the Fed was inflation and given the falls in commodity prices, USD strength, Chinese devaluation and mixed economic data; there just hasn't been enough improvement to warrant a hike.
As a result, the US dollar plunged on the Fed minutes. EUR/USD rose to 1.1125 from 1.1050 and USD/JPY fell to 123.80 from 124.40 at the start of US trading.
Two things stand out in terms of price action:
1) The failure of the US stock market to gain on the dovish turn in sentiment. Stocks rebound to unchanged shortly after the Minutes but then sank 0.8%. A bull market that can't rally on a dovish Fed might soon be a bear market.
2) Gold climbed to a three week high. Gold has held its ground in varying periods of USD strength and weakness in different risk environments over the past month. Gold finished $16 higher on the Fed and USD weakness but the FX devaluation story threatens to be the longer-term story and the technicals are improving.
As markets roll towards September the Fed story will dominate. The first chance for officials to fine tune the story comes at 0645 GMT when the Fed's Williams speaks in Jakarta. There's an embargoed text so there will likely be some commentary on the outlook. On Thursday, the event to watch is the Philly Fed. If it confirms the weakness in the Empire survey earlier this week, it will be another reason to doubt a hike (and to sell US dollars).
| Act | Exp | Prev | GMT |
|---|---|---|---|
| Fed Minneapolis's Narayana Kocherlakota speech | |||
| Aug 20 0:20 | |||
| FOMC's Williams speech | |||
| Aug 20 6:45 | |||
| Philadelphia Fed Manufacturing Survey (JUL) | |||
| 7.0 | 5.7 | Aug 20 14:00 | |
Shanghai & DAX-30 Dance around 200-DMA
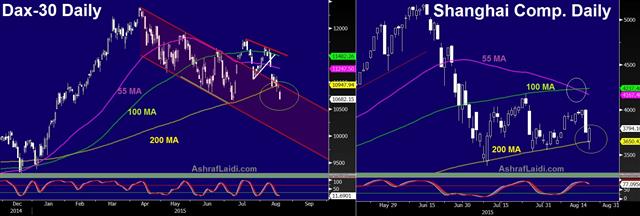
Overnight, China central planners saved the 200-DMA in the Shanghai Composite, with an intraday 6.7% recovery following an earlier 5% decline. This is especially crucial as the index held above its 200-DMA since Jul 23, 2014. The latest selling pressure may have resulted by three consecutive daily gains in the Chinese yuan, following media assault from the rest of the world on the day of the CNY devaluation. Coincidently, the Shanghai Composite's late Wednesday session recovery emerged on the day the CNY depreciated for the first time four days.
DAX Heading to 10,000
You don't hear commodities and the Dax mentioned often in the same sentence. But 3 of the 4 worst performing shares in Germany's Dax index over the last 4 weeks are associated with gas and oil (RWE -51%, E.ON -24% and BASF -12% from Jul 20 to today). As the index falls below its 200-DMA for the first time since January, we note that each of the two occasions of the sub-200-DMA drop in December and January lasted no more than two days. We would have to go to the infamous October 2014 for the last time the index fell 12% below its 200-DMA.Both of the Shanghai Composite and Dax, the 50-100 DMA Death Cross has already occurred. It is a matter of time before the former extends selloff to 3,100 and the latter retests 10,000.
Ashraf on BNN
My hit on BNN earlier today about why the Fed will not hike in September and insights on China, the euro, the loonie & emerging markets.
FULL INTERVIEW

نحو التضخم و شهادة لقاء الاحتياطي الفدرالي
Crowded Commodity Conundrum
The long USD/short commodities trade has been the most popular trade of the past 12 months but that also makes it the most vulnerable. The Canadian and New Zealand dollars climbed in US trading Tuesday despite a strong US dollar. Australian skilled vacancy data is due later.
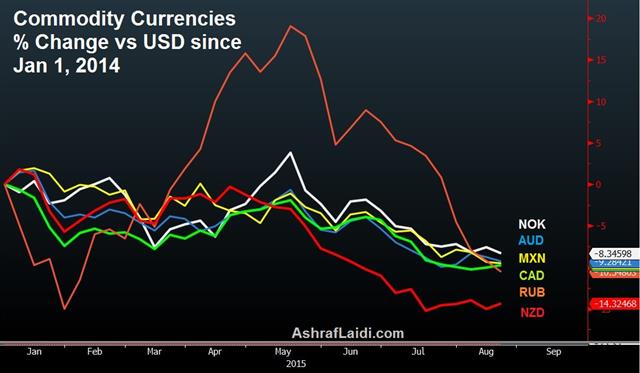
A crowded trade is a dangerous one and the commodity basket is showing signs of life. Even as oil fell over the past week, USD/CAD has been unable to break above 1.32 while a small bounce in crude today sent the pair to 1.3050, even as the US dollar retained a broader bid.
The New Zealand dollar faced a 5-month headwind from collapsing milk prices but today's dairy auction climbed for the first time since March, jumping 14.8%. If prices can stabilize it puts the RBNZ in wait-and-see mode with a still-appetizing 3.00% overnight rate.
It's early but commodity currencies have shown some early signs of basing over the past two weeks. If physical commodities can bounce, or the US dollar is hit by dovish news (CPI and the Fed Minutes are on Wed), then a larger squeeze may be in the cards.
Up next, the Australian dollar is in focus with July skilled vacancy data a 0100 GMT. Previously, vacancies fell 0.9%. Other data includes Japan's all industry activity index at 0430 GMT and Japan dept store sales at 0530 GMT. Soft data could weigh on the yen after Monday's weak Q2 GDP print.
| Act | Exp | Prev | GMT |
|---|---|---|---|
| All Industry Activity Index (JUN) (m/m) | |||
| 0.4% | -0.5% | Aug 19 4:30 | |
UK CPI & Diverging TWI-Cable Rates
Sterling hit fresh 2-month highs as UK inflation improved in July, with headline CPI edging up to 0.1% y/y from June's 0.0%, and beating the Bank of England's 0.0%. The notable increase was in core CPI, which rose to a 5-month high of 1.2% vs expectations of 0.9% and a June reading of 0.8%.
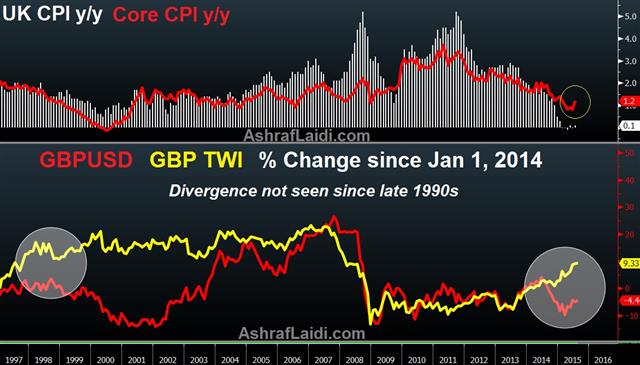
The rise in CPI had been attributed to higher clothing and footwear prices as discounts were reported to have taken place earlier this summer than last year. House prices edged up 5.7% in June from May's 5.6%.
Watching Core-CPI Spread
As the spread between UK core and headline CPI bounces back to 1.1%-- nearing February's all-time high of 1.2%-- and the headline figure remains compressed, further gains in the core rate will get the attention of sterling bulls, especially with no reprieve in energy prices.GBPUSD vs TWI Divergence
The role of sterling in containing inflation remains notable. But even more important is the divergence between sterling's trade-weighted index (using the BoE's broad TWI) and GBPUSD spot rate, which had widened between July 2014 and April of this year before gradually narrowing. The divergence between the two rates was last seen in the late 1990s, coinciding with plummeting oil prices. But unlike in the 1990s, when the divergence extended into Spring 2000, today, GBPUSD is rising back up alongside the TWI, with any dips in cable being bought instantly.Growing expectations of a Fed hike had kept GBPUSD under pressure, but rising odds of a BoE rate hike relative to other central banks helped lift GBP against all major currencies, thereby sending GBP's TWI to fresh 7-year highs earlier this month.
Barring UK earnings and other endogenous factors, Fed hike expectations remain the chief factor in slowing down sterling's TWI ascent. Any receding odds of a September liftoff will likely lift GBPUSD back towards the $1.60 figure and closer to $1.65 where the main longer term 100 and 200-month moving averages lie.
| Act | Exp | Prev | GMT |
|---|---|---|---|
| CPI (JUL) (m/m) | |||
| -0.2% | -0.3% | 0.0% | Aug 18 8:30 |
| CPI (JUL) (y/y) | |||
| 0.1% | 0.0% | 0.0% | Aug 18 8:30 |
| Core CPI (JUL) (y/y) | |||
| 1.2% | 0.9% | 0.8% | Aug 18 8:30 |
Factories Could Fluster Fed
The worst reading on the Empire Fed in six years puts the focus on US manufacturing and the effect of the strong dollar. The kiwi was the top performer Monday while the pound lagged. The RBA meeting minutes are up next.
A plunge in new orders dropped the Empire Fed to -14.9 compared to +4.5 expected. The huge miss initially weighed on the dollar but it's far too soon to say that the strong dollar is crippling manufacturing. Another explanation is that bloated Q2 inventories are being run off. In any case, the market will now sharpen the focus on factories starting with the Philly Fed on Thursday. Out of the 5 existing trades in the Premium Insights, one AUD-related pair is open ahead of tonight's RBA minutes.
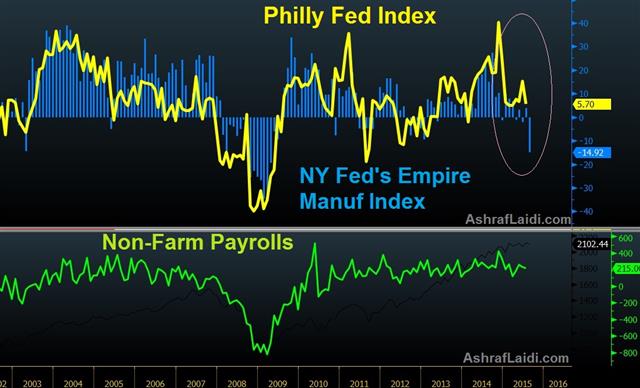
Despite the soft reading, the dollar showed some impressive resilience on Monday, in particular against the euro. EUR/USD jumped a quarter-cent to a session high of 1.1125 after the data but slowly sank to 1.1058 later. The decline came amidst better risk appetite in a sign that the euro is the favoured funding currency.
The Canadian dollar was also under pressure early but rebounded along with a bounce in oil prices. Cable was soft throughout the day ahead of Tuesday's critical UK CPI reading.
First, the focus is on Australia. AUD/USD has settled into a 0.7250 to 0.7450 range in the past three weeks. It may be attempting to bottom but that will depend on what the RBA does next. We'll get a clue at 0130 GMT when the RBA releases the minutes of the latest meeting. Stevens is seen on hold for a period but the minutes could fire a fresh salvo of jawboning towards AUD.
Another Aussie factor to monitor is a report in the state-run China Securities Journal saying the PBOC may lower the RRR because of tight lending conditions. The danger in a rate cut so soon after a devaluation is that it may be seen as a sign of desperation because of a floundering economy. In that case, AUD could decline while safe assets like gold and Treasuries may get a boost.
| Act | Exp | Prev | GMT |
|---|---|---|---|
| RBA Meeting's Minutes | |||
| Aug 18 1:30 | |||
| CPI (JUL) (m/m) | |||
| -0.3% | 0.0% | Aug 18 8:30 | |
| Core CPI (JUL) (y/y) | |||
| 0.8% | 0.8% | Aug 18 8:30 | |
| CPI (JUL) (y/y) | |||
| 0% | 0% | Aug 18 8:30 | |
مقابلتي مع لارا حبيب على قناة العربية
تحليلاتي في قناة العربية على الصين، الأحتيااطي الفدرالي، الدول الناشئة وعملاتهم
Why has Druckenmiller Dived in Gold & Copper
Four weeks after gold tumbled to 5-year lows on revelation of far lower Chinese gold holdings than previously anticipated, gold bulls find out that one of the world's greatest hedge fund managers made gold the biggest holding in his fund in Q2. He also loaded up on 2 large miners.
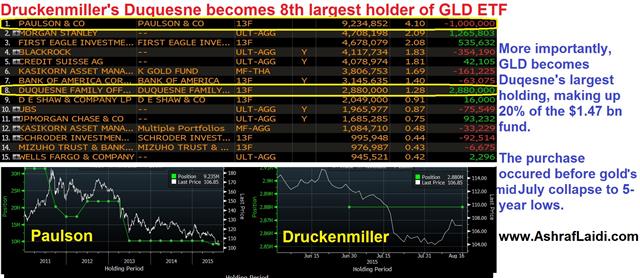
Stan Druckenmiller's family office, Duquesne Capital Management, bought 2.9 mn shares of SPDR Gold Trust's GLD ETF, worth $323.6 million at the end of June, according to the Securities and Exchange Commission's quarterly filing. Duquesne's gold ETF purchase bumped the fund's Facebook holdings off the 2nd position to become the biggest holding in the $1.47 bn fund.
Druckenmiller acted as George Soros' chief strategist when he helped execute the shorting of the British pound to the extent of forcing the UK out of the Exchange Rate Mechanism in September 1992. Since its inception in 1986, Duquesne has had an average return of 30% per year. In early May, Druckenmiller told Bloomberg in May that interest rates were likely to stay near 0% for 10 years, casting doubt over whether the Fed would ever move to liftoff.
Druckenmiller vs Paulson
Despite the scale and timing of Druckenmiller's gold position, it remains unclear whether the trade is a long-term bet on the stabilisation of gold resulting from a possible peak in the USD and lack of Fed hikes, or is a short-term trade aimed at taking profit after a brief bounce. The fact that Druckenmiller has also purchased 1.28 mn shares of gold miner Newmont Mining and 3.6 mn shares of copper giant Freeport-McMorcan in the same quarter could indicate he's in it for the long run.In contrast to Druckenmiller, John Paulson, the biggest holder of the GLD ETF, sold 11% of his holdings in Q2 after initially slashing them by 50% in Q2 2013 during gold's 25% collapse that quarter. While Paulson is the biggest owner of GLD, accounting 4% of the ETF, the fund makes up less than 5% of Paulson & Co's holdings, ranking 7th out of 64 different securities. More importantly, Paulson's gold selling is a result of forced redemptions whereas Druckenmiller's entry is an accumulation at a far stronger position.
As John Paulson is quietly planning an exit out of his gold holdings, Druckenmiller is prominently loading up on the yellow metal.
IMF Doubtful on Greece, Japan GDP Next
The IMF balked as European leaders approved the Greek bailout. The euro was the top performer last week while the kiwi and Aussie lagged. The trading week starts with top-tier economic data with a first look at Japanese Q2 GDP. GBP extended its Friday's gains in early Pacific Monday trade after BoE's Forbes said low headline CPI may hide underlying inflationary pressures and that rates will have to rise before CPI reaches 2.0%. On Friday, Ashraf's Premium Insights added 2 new charts (including the latest implied volatility for GBPUSD) and note to the existing Premium long ahead of this week's key UK CPI & retail sales figures.
Early-week trading shows few changes after a quiet weekend. China didn't deliver a rate cut or make any special announcements. Instead, the focus was back on Greece where IMF leader Lagarde said Greek debt is unsustainable. European leaders led by Germany believe that reprofiling and maturity extension is enough but the IMF isn't convinced. Merkel said the IMF will come around by October in what's the first chapter in the latest Greek saga. For now, markets aren't tuned into Greece.
The first piece of economic data to start the week is Japanese GDP at 2350 GMT. The consensus is for a 1.8% annualized contraction after a 3.9% expansion in Q1. That would leave the economy hobbling along near 1% growth. Weak consumption and slow exports despite the soft yen are the culprits. A miss may be shrugged off if it's driven by inventories but if private consumption lags below the -0.4% consensus or business investment is soft (exp: 0.0%), the yen could weaken.
Realistically, even a soft quarter wouldn't put pressure on the BOJ to act but if appears as though Q3 will be soft, the case for yet another round of easing improves.
The other event on the calendar is the yuan daily fix at 0115 GMT. USD/CNY was set at 6.3975 on Friday and closed at 6.3912. In all likelihood, the yuan will be lifted for the second consecutive fixing, which will continue to ease nerves.
Commitments of Traders
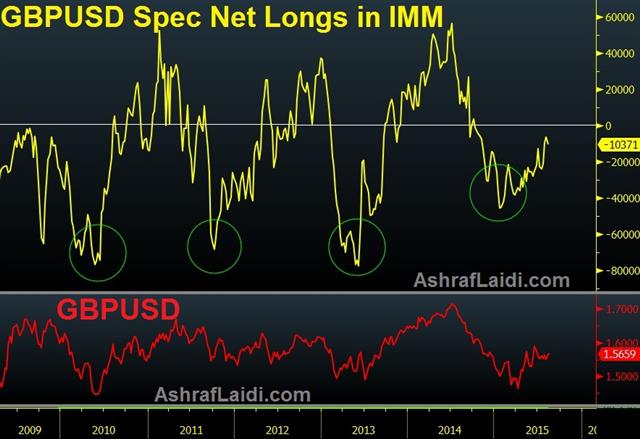
Speculative net futures trader positions as of the close on Tuesday. Net short denoted by - long by +. EUR -115K vs -113K prior JPY -105K vs -80K prior GBP -10K vs -10K prior AUD -51K vs -50K prior CAD -67K vs -64K prior CHF -7K vs -1.5K priorThe jump in yen shorts is a surprise. There wasn't any particular catalyst for the shift but it helps to explain why USD/JPY hit a two month high Wednesday. One line of thinking is that PBOC devaluation will be followed by similar actions from Asian central banks, including the BOJ.
| Act | Exp | Prev | GMT |
|---|---|---|---|
| GDP Annualized (Q2) | |||
| -1.9% | 3.9% | Aug 16 23:50 | |
| GDP (Q2) (q/q) | |||
| -0.5% | 1.0% | Aug 16 23:50 | |
| GDP Deflator (Q2) (y/y) | |||
| 3.4% | Aug 16 23:50 | ||


