Intraday Market Thoughts Archives
Displaying results for week of Mar 19, 20233 Faces of $2000 Gold

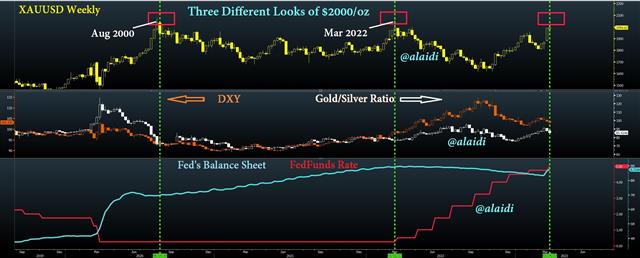
AUGUST 2020 : Gold's first print of $2000/oz occurred on 28th Jul 2020, one day after it had finally broken the £1920 record attained on September 2011. The dynamics were plenty and ideal. The +$10 trillion governmental stimulus response to combat Covid-19 was three times the size of the response to the 2008/9 financial crisis. Any signs of USD-liquidity crisis was swiftly suppressed. The Fed crushed interest rates back to zero and sent its balance sheet doubling to $7.2 trillion in under five months.
The combination of exploding financial liquidity, force majeure fears and tumbling US dollar was the perfect scenario for metals and financial stocks. Gold bugs did not blink, hitting a new record of $2075 on Friday, August 7th 2020.
MARCH 2022: Gold's ascent to $2000 in March 2022 was the product of an unprecedented combination of geopolitical/nuclear uncertainty (first total war in Western Europe in 80 years), and biggest supply shock in energy, agricultural and metals commodities. Unlike the central bank liquidity creation and government stimuli of 2020, which gradually elevated inflation and later commodities, the outright supply shock and geopolitical uncertainty of the Russia-Ukraine War triggered immediate inflation and shortage repercussions. It was the first time in over four decades, when the classic macro geopolitical playbook of rising USD, gold and oil) played out.
How we called Gold's peak 1 day before the $2075 Top of 2020 Watch Video
MARCH 2023: Gold's rally of late 2022 emerged on the Fed's slowing down its tightening campaign even as inflation remained 3x the Fed's target. Growing signs of stress in US treasury markets, coupled with the 2nd biggest US bank failure in history as well as ongoing inflation force the inevitable conclusion: Looming credit contraction and rate hikes' lag effect will force down yields (and possibly rates) faster than the Fed anticipates. And if that keeps inflation above 3.0%, then it's a new normal for gold bulls.
For the first time since March 2020, the Fed Funds rate is now above Fed's preferred inflation gauge (Core PCE). Emerging signs of real positive rates and unflattening of the US yield curve should continue to prop gold higher, as long as the upcoming recession is not too severe for industrial metals to corrode and for deflation to return.
Regardless of whether SVB's was a case of poor asset-duration mismatch, or whether the Fed should have caught it well before, the aftermath is the following: Deepening credit contraction + tightening bank lending standards. Add to it the Fed's attempt to keep some semblance of quantitaive tightening and a fresh reflex to ease becomes inevitable. That's how it was in summer 2019 and that's how it will be late this summer.
Guiding Through Confusion إرشاد خلال الصاعقة

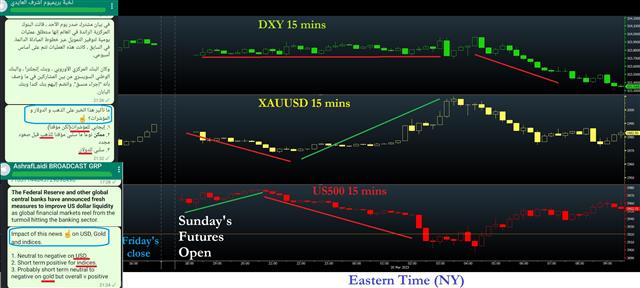
Five minutes after the coordinated central bank announcement, I sent out a message on how I viewed the developments impacting USD, gold and equity indices. My take was that it was: “Neutral to negative on USD; Short term positive for indices and probably short term neutral to negative on gold but overall v[ery] positive”. The outcome was exactly what happened as shown in the 15-min charts on DXY, US500 and US500. No, we neither sent out a video or a 400-word piece explaining FX liquidity operations, nor speculated on the likelihood of success of such developments. We simply got to the point in guiding our WBG members.
You can bet your final this is not the last time you'll hear breaking markets news on a Sunday night.


