Intraday Market Thoughts Archives
Displaying results for week of Nov 08, 2015أشرف العايدي في سي ان بي سي العربية
USD Slips, Oil Slides, Fischer Dithers
The US dollar was under pressure for the third day as stocks markets declined. The Australian dollar finished as the top performer but never climbed above the jobs-spike high; the kiwi lagged. After 7 speakers from the Fed, the US dollar ended lower across the board. Even Vice Fed Fischer's speech on FX & transmission mechanism failed to to reverse the greenback's decline. Japanese industrial production is due later.
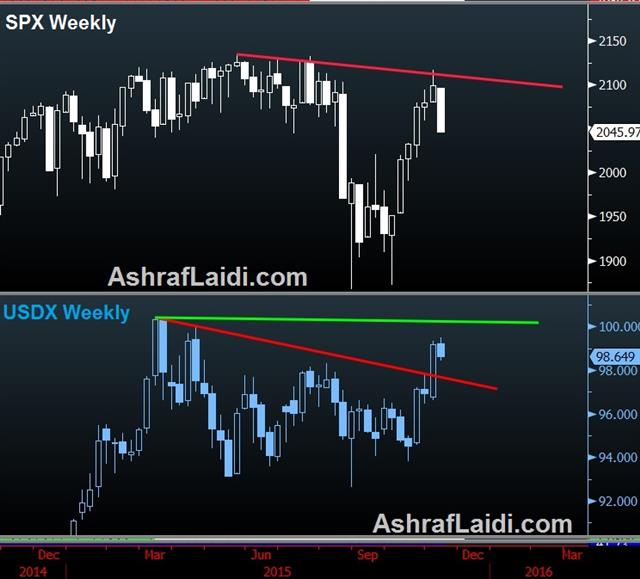
Fischer said the Fed's October decision to delay raising interest was appropriate as it helped offset the economic headwinds caused by the apprecitaing US dollar, adding that “may be appropriate” to raise rates next month. "While the dollar's appreciation and foreign weakness have been a sizable shock, the U.S. economy appears to be weathering them reasonably well". Economics aside, Ashraf tells me it is evident that a 7-10% decline in equities from here til mid Dec, and/or a disappointing NFP as (below 150K), as well as a few bad corporate would undoubtedly force the Fed to stay its had, which is another compelling reason that market dynamics are greater in importance than selective improvements in the macro picture.
The correlation between the US dollar and stock market was tight on Thursday. Repeated rounds of declines in the S&P 500 were mirrored by USD selling.
What's driving the correlation? The US economy is the engine of developed-world growth at the moment and it's attracted significant investment flows. In the past that money would have gravitated to the Treasury market and short-term debt but because of low returns it's been pushed into riskier assets like corporate bonds and stocks.
On Thursday a series of Fed speakers – often conflicting – led to uncertainty and dollar investors edged towards the exits. Throughout the day it was self-reinforcing and peaked at the end of US trading as the S&P 500 fell 29 points and the euro hit a session high.
Importantly, the scope of USD declines is still well within reasonable retracement levels after the sharp moves last week.
The other factor we're watching is oil. Crude is down in 6 of the past 7 days, falling another 3.1% on Thursday. We made the case for oil shorts yesterday on oversupply concerns and today's EIA inventory data showed another 4 million barrel build.What's interesting in FX is that CAD has held up relatively well. That could be a sign of Canadian dollar resilience but it's more likely that CAD-weakness is hidden by the latest blip in USD and Wednesday's holidays.
Looking ahead, keep an eye out for the speech from the Fed's Fischer on "FX Transmission to Output, Inflation” at 2300 GMT. At 0430 GMT, Sept Japanese industrial production is due but it's the final revision and unlikely to move markets.
| Act | Exp | Prev | GMT |
|---|---|---|---|
| FOMC's Mester speech | |||
| Nov 13 17:30 | |||
| Industrial Production (SEP) (m/m) | |||
| 1% | Nov 13 4:30 | ||
| Industrial Production (SEP) (y/y) | |||
| -0.9% | Nov 13 4:30 | ||
Aussie Jobs Soar, but Capex far from Done
It's not the first time an Australian jobs report shows employment growth rise five times more than expected. Whether it will be revised downwards or not, it is undoubtedly reflecting partial strength in the nation's labour market. Australia added a net 58.8K jobs in September; over four times expectations, the highest increase in 3 ½ years and the 3rd biggest jump over the last 15 years. Remarkably, 40K of the 58.8K increase emerged from full time jobs, while only 18.6K was from part time employment. The 231.7K increase jobs in the first 10 months of the year showed the its biggest annual gain since 2010.
The unemployment rate surprisingly fell to an 18-month low of 5.9% from 6.2%, while the labour participation rate actually rose to 65.0% from 64.9%.
The Aussie had already been boosted in the days prior to the release of the jobs report, amid increased signals the RBA would stand pat on rates next month, due to upside surprise in Nov Westpac consumer confidence (6-month high at 101.7), last week's release of Sep retail sales and other improved sentiment surveys such as the ANZ Roy Morgan Weekly indices.
The Aussie jobs report is a manifestation of the dichotomy between the housing boom in Southeastern states of Victoria and New South Wales, where jobs rose 26,100 and 18,700 respectively, while in the recession hit mining state of Western Australia, unemployment rose to 6.4% from 6.1%.
More Capex Declines ahead
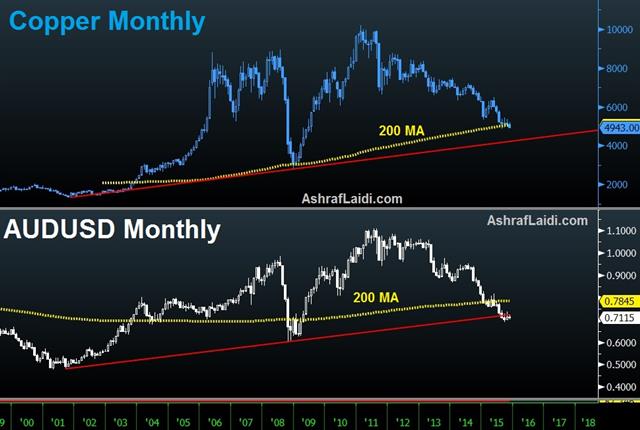
If you think the Aussie jobs report is a prelude to an ongoing stabilisation in the overall economy, then think again. Neither is the all-clear sign on commodities. Chinese fixed-asset investment rose at an average annual rate of 10% in the first 10 months of 2015, its slowest since 2000. Industrial production growth is back to six-year lows.Mining capital expenditure more than quintupled since 2000, reaching $30bn a year to $160bn. As capacity soared, global iron production rose 125% according to Marathon Asset Management. Once demand failed to meet supply, commodity plummeted with the help of a resurging US dollar.
Just as oil prices are pressured by global production of 95.48 mn/barrel/day, exceeding demand of 93.86 mn/barrel/day (not to mention Iran's intentions to double production), mining capacity has yet to withdraw its excess for prices to stabilize. This requires more cuts in capex.
You don't need to be a regular reader of this column to know I've been calling for sharp cuts in capital expenditure by miners and energy exploration companies for quite a long time. It started on Dec 23 of last year in my 2015 Preview here, followed by July 17 and Sep 22. It went on but I'll spare you.
Falling capex will remain a net negative to global growth, exceeding the positives of cheaper energy/metals. The resulting decline in prices will also be made possible with the help of further Chinese currency devaluation. Considering that China went from importing 50% of most commodities to seeing its imports plummet by 50%, the demand and price impact has yet to play out.
| Act | Exp | Prev | GMT |
|---|---|---|---|
| Retail Sales (OCT) (m/m) | |||
| 0.3% | 0.1% | Nov 13 13:30 | |
| Retail Sales (ex. Autos) (OCT) (m/m) | |||
| 0.4% | -0.3% | Nov 13 13:30 | |
Supply Problems: The ECB and Oil
Traders in the euro and oil market are faced with two very different supply questions. Trading was solid Wednesday despite holidays as the pound led the way on jobs data while the US dollar lagged. Australian jobs numbers are due later. A new AUD long trade with 4 charts have been issued ahead of the Aussie jobs report, due 30 mins from now. A new GBPJPY note has also been issued on the existing trade.
The Eurozone supply problem is bonds. A report Wed revealed the ECB is looking into municipal bonds in order to expand QE. At first blush more QE sounds like a euro negative and that was the kneejerk in the market as EUR/USD fell near 1.0700. But deeper analysis highlights a problem: If the ECB is digging around the muni market, then it can't find enough bonds to buy.
We highlighted a leak earlier this week saying expanding ECB QE could be hard because of the lack of bond supply. Examining munis looks like a desperation move and the euro has recovered to 1.0758.
Overall, the case for the euro is still tenuous. Even if the ECB can't find enough bonds to satisfy the market's hopes for an additional 15 billion/month for at least 6 more months, then the ECB may take additional steps elsewhere to balance it out.
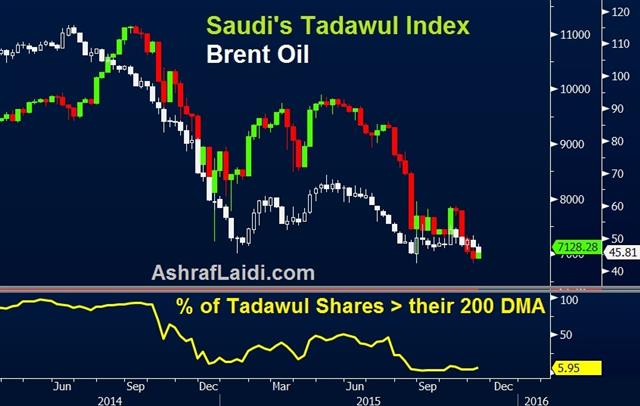
The oil supply problem is more straightforward. In some commodities, a bit of extra supply can be easily put into storage. Miners can stockpile and defer profits. Oil is different. Storing crude is difficult , costly and it is difficult to build storage facilities.
Still, there is tremendous infrastructure to maintain strategic reserves and commercial stocks. But it's not unlimited and with supplies continuing to grow far faster than demand, a breaking point is near. According to the EIA, global production at the moment is 95.48 mbpd; demand is 93.86 mbpd. That means every day nearly 1.4 million barrels of oil need to find storage.
Iran alone wants to double exports to 2.3 mbpd from 1.2 mbpd.
The latest API figures showed another 6 million barrels going into US storage last week. Shale production hasn't fallen off the way many analysts through it would.
Eventually, the oil will simply flood the market. Demand is largely inelastic for oil so there will be very little support for crude. We may be seeing the beginnings of another decline at the moment as Brent fell to the lowest since Aug on Wed.
In FX, the Australian dollar is the near-term focus. At 0030 GMT, October employment data is due and expected to show a 15.0K increase after a 5.1K decline in Sept. Unemployment is forecast at 6.2%. In the event of a disappointing report, there is very little support until 0.6950/6900.
| Act | Exp | Prev | GMT |
|---|---|---|---|
| Employment Change s.a. (OCT) | |||
| 15.0K | -5.1K | Nov 12 0:30 | |
| Fulltime employment (OCT) | |||
| -13.9K | Nov 12 0:30 | ||
| Part-time employment (OCT) | |||
| 8.9K | Nov 12 0:30 | ||
| Unemployment Rate s.a. (OCT) | |||
| 6.2% | 6.2% | Nov 12 0:30 | |
Stalemate a Win for USD Bulls
Moves on the day were modest but there were some positive signs for the US dollar. The loonie was tops on the day while the Swiss franc lagged but total moves in the majors were less than 30 pips against the US dollar. Chinese retail sales and industrial production data are due later.
There were no significant directional moves on Tuesday but one thing stood out: iIn US trading alone, AUD/USD, USD/CAD and USD/JPY all hit daily session highs and session lows. Yet none of them extended on breaks.
The lack of follow-through speaks to a lack of conviction at the moment and that's not a big surprise given the magnitude of recent US dollar moves. Most impressive is that dollar retracements failed to gather any momentum. Cable made a quick 35-pip spike to 1.5140 at the start of US trading but was quickly beaten back down even though that's only a tiny retracement in relation to last week's decline. GBP & FTSE traders await Wednesday's UK jobs and earnings figures, covered in detail in Ashraf's Premium Video yesterday.
The Australian dollar also touched a one-month low on falling copper while EUR/USD hit the worst level since April.
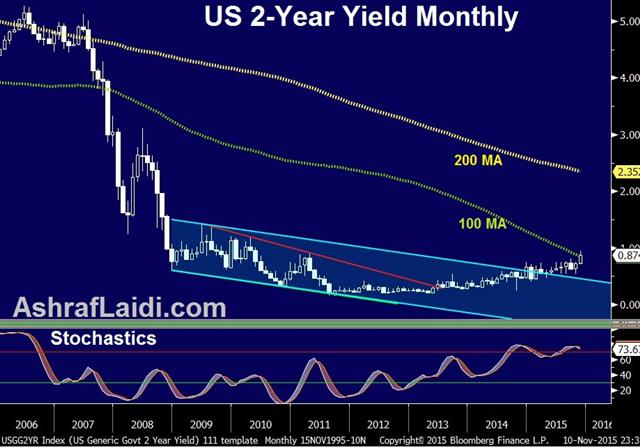
Overall, the stability of the greenback is a positive sign for the dollar bulls as the refuel for another run. If there is a spot to watch in case of a retracement, it's the bond market. The dollar came under some pressure after a slightly lower-than-expected yield at a Treasury auction for the second consecutive day. Yields managed to rebound to unchanged after declining early but it's an area we'll watch closely.
The economic data we're watching in the hours ahead is from China. Retail sales and industrial production are due at 0530 GMT. Sales are expected up 10.9% y/y in what's a bright spot in the economy as China moves towards a consumer-driven model. Industrial production is expected up 5.8% y/y.
| Act | Exp | Prev | GMT |
|---|---|---|---|
| BRC Retail Sales Monitor - All (OCT) (y/y) | |||
| -0.2% | 2.6% | Nov 10 0:01 | |
| Retail Sales (OCT) (y/y) | |||
| 10.9% | 10.9% | Nov 11 5:30 | |
| Industrial Production (OCT) (y/y) | |||
| 5.8% | 5.7% | Nov 11 5:30 | |
| BOE's Governor Carney speech | |||
| Nov 11 10:30 | |||
ECB May Struggle With QE vs Rate Cut
The headline from Monday's ECB sources story dealt with a deposit rate cut but buried deeper was a hint that more QE will be difficult. USD retracement was the theme of the day as the greenback underperformed, while GBP led. Japanese current account data was a disappointment. Chinese CPI figures are up at 1:30 am GMT. A Premium Video on equity indices and a new trade was issued today. Full details found here.
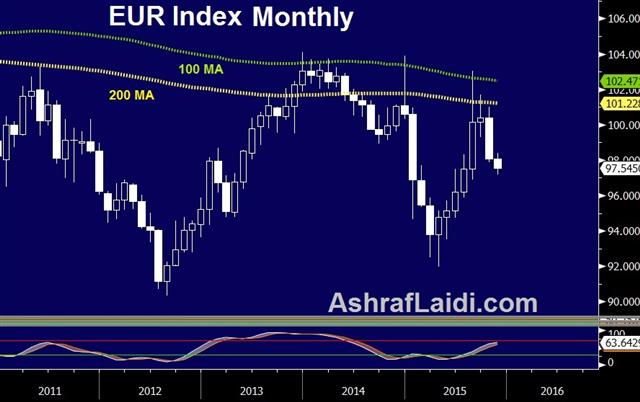
Reuters spoke to three unnamed ECB governing council members in an exclusive story focused on the December meeting. The main thrust of the story was that a consensus was forming at the ECB to delve deeper into negative territory on the deposit rate.
Yet the details of the story commit to nothing. They say a deposit rate cut is the least contentious proposal and hint at a move larger than 0.1 bps expected but the idea of a much deeper cut does not sound like a consensus opinion. What's perhaps more interesting is that expanding QE could be difficult.
The officials said extending the timeline would have a limited impact while adding assets like corporate bonds or equities would create problems. There is little detail on the QE opinions but it raises the possibility that the ECB may find it more difficult to ease than Draghi has let on.
That may help explain why the euro was relatively resilient after the report. It initially fell but later recovered the declines. Overall, the US dollar came under modest pressure as a small portion of the NFP move was retraced. If anything, the small size of the bounce indicates that USD bulls are in charge.
On oil, Ashraf highlighted a report that Saudi Arabia is set to tap international bond markets for the first time. The kingdom is no-doubt in a cash crunch but officials are convinced that if they can battle through the next 1-2 years, they will be in a strong position. Tapping the bond market shows a longer-term resolve and that's negative for oil.
In early Asia-Pacific trading, Japan reported a 1.47T yen current account surplus in Sept, well below the 2.15T expected. The BOJ has stepped back from QE for now but it's the only item in the bag of tricks and eventually they will find more money printing an easy option.
| Act | Exp | Prev | GMT |
|---|---|---|---|
| Current Account n.s.a. (SEP) | |||
| ¥1,468.4B | ¥2,235.2B | ¥1,653.1B | Nov 09 23:50 |
| Consumer Prce Index (OCT) (m/m) | |||
| -0.2% | 0.1% | Nov 10 1:30 | |
| Consumer Prce Index (OCT) (y/y) | |||
| 1.5% | 1.6% | Nov 10 1:30 | |
Equity Indices Video
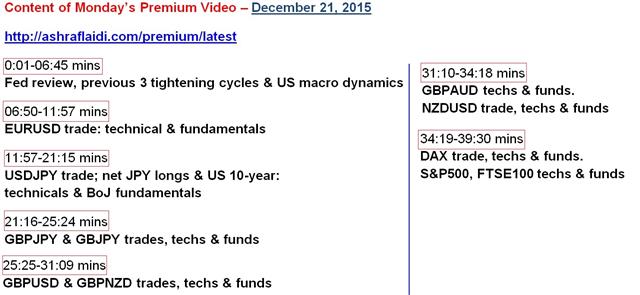
Today's Premium Video is up, focusing on the major equity indices. Here's the list of the Table of Contents below. Full Video for Premium members.
Trade Highlights China Slump; CFTC Misstep
Weekend trade figures raise fresh questions about the health of the Chinese economy and the implications for its trading partners. The US dollar is higher in early trading as the NFP momentum continues. CFTC data showed more euro sellers and a misstep from cable traders.
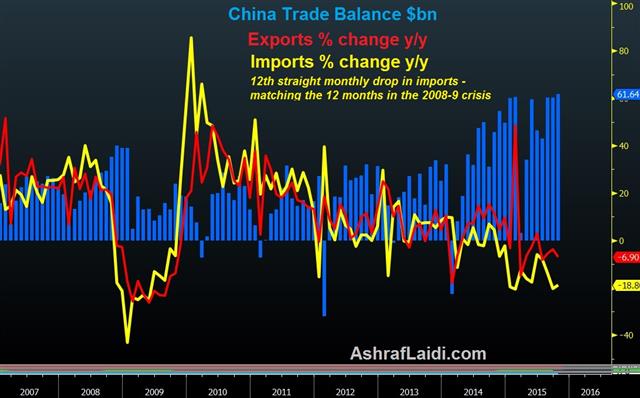
Confidence in the US economy was the message from the Fed's Williams on the weekend but evidence of a slowdown in China and the global economy continues to mount. China released weak trade balance numbers on the weekend. Imports fell by 18.8% y/y compared to 15.2% expected but perhaps the more worrisome number in the latest data is a 6.9% y/y decline in exports compared to -3.2% forecast. It was the 12th straight monthly drop in imports , matching the 12 months of decline in the 2008-9 crisis.
The soft imports number could be explained away by China investing less in infrastructure but the sharp weakening in exports is extremely difficult to explain for an economy that's supposedly growing at a 6.9% pace.
Since late August the market has increasingly brushed aside Chinese data in the belief that Chinese stimulus will eventually overcome the slowdown. That's the theme once again in early trading as the Australian dollar trades down just 10 pips early in the week.
China has proven resilient for the past two decades and that's a recipe for complacency. Chinese stocks climbed nearly 8% in the final three trading days of last week but still remain 30% below the June peak.
Commitments of Traders
Speculative net futures trader positions as of the close on Tuesday. Net short denoted by - long by +.EUR -134K vs -106K prior JPY -44K K vs -34K prior GBP 0K vs -34K prior AUD -39K vs -36K prior CAD -19K vs -19K prior
It's the second week in a row of a large increase in the euro net short. Bets against EUR have more than doubled since Draghi strongly hinted at more action in December. The US dollar will get a fresh tailwind in next week's data from the US jobs data. The other big move was in the pound but it shows how badly speculators misread what was coming from the BOE. That kind of whipsaw will make traders wary of the pound for awhile.
| Act | Exp | Prev | GMT |
|---|---|---|---|
| Trade Balance (OCT) | |||
| $61.64B | $62.00B | $60.34B | Nov 08 3:00 |
| Trade Balance (OCT) | |||
| 393.20B | 376.10B | 376.20B | Nov 08 3:00 |
| Imports (OCT) (y/y) | |||
| -18.8% | -16.0% | -20.4% | Nov 08 2:00 |
| Imports (OCT) (y/y) | |||
| -18.8% | -15.2% | -20.4% | Nov 08 3:00 |
| Imports (OCT) (y/y) | |||
| -16.0% | -11.7% | -17.7% | Nov 08 3:00 |
| Exports (OCT) (y/y) | |||
| -6.9% | -3.0% | -3.7% | Nov 08 2:00 |
| Exports (OCT) (y/y) | |||
| -6.9% | -3.3% | -3.7% | Nov 08 3:00 |
| Exports CNY (OCT) (y/y) | |||
| -3.6% | -3.1% | -1.1% | Nov 08 3:00 |


