Intraday Market Thoughts
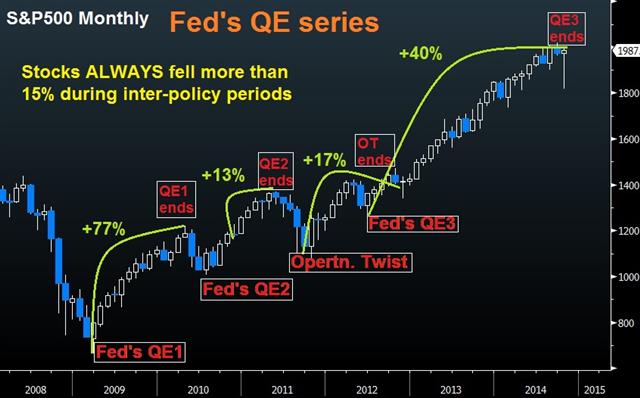
Charting S&P500 vs Fed Policies
by
Oct 29, 2014 16:49
As we approach the Fed decision, the chart analysis below reminds us that stocks market consistently fell by more than 15% between the conclusion of the Fed stimulus programs; between the end of QE1 and start of QE2; and between the end of QE2 & start of Operation Twist. Full analysis
Click To Enlarge
Latest IMTs
-
Iran Polymarket & Fed Odds
by Ashraf Laidi | Feb 20, 2026 11:27
-
Gold, Iran & Oil
by Ashraf Laidi | Feb 19, 2026 16:40
-
Trade Already in Profit
by Ashraf Laidi | Feb 17, 2026 18:16
-
I will go LIVE in 10 mins
by Ashraf Laidi | Feb 16, 2026 21:49
-
3 Stocks Against Nasdaq
by Ashraf Laidi | Feb 13, 2026 17:46


