Nearing Total Yield Curve Inversion

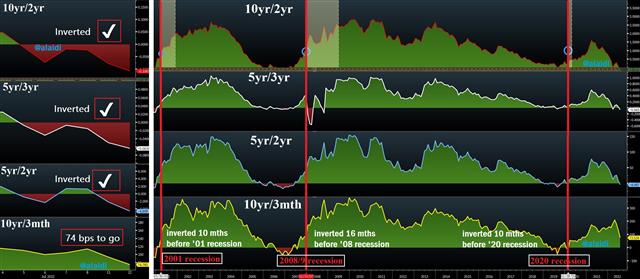
The chart below shows that three of four yield curve measures have inverted. The 10yr/3mth has yet to fall below zero. But it's worth noting that since not all economic slowdowns are alike, the reaction across different yield tenors (different yields across the curve) differs according to treasury supply/demand (issuance and demand of new govt bonds, extent of post-tapering runoff from the Fed and inflation breakevens).
Let's take the 2020 recession as an example-- which the US National Bureau of Economic Research gave an official duration of 2 months…yes…2 months. By summer 2019, three of the four measures shown in the chart went into inversion, with the exception of the 10yr/2yr, which inverted for a mere 4 days. The duration of the inversion can also give an idea about the length of recessions.
More relevant and unique for today's dynamics is the contrast between short term yields remaining “stuck higher” relative to the rapid descent in inflation breakevens. One thing worth noting, which is weighing on commodities--including metals—is that shorter-term inflation breakevens (such as 2-year) are falling faster than their longer-term counterparts (such as 10-year), which means that inflation expectations are repriced down more sharply on the short-term. This especially poses a drag on metals. I've written about this last month in this piece
As we head into tomorrow's release of the June CPI, it's worth focusing on the real average earnings release part of the report, especially after earnings slowed in last week's release of the June jobs report.
Finally, if we look at the duration between the point of inversion in the 10yr/3mth and the start of each three recessions, we find an average duration of 12 mths [ (10+16+10)/3 as seen in the chart]. Does this mean an inversion of the 10yr/3mth this summer would imply the official start of recession by Q2 2023? Very likely…if not before.
About that Fed Pivot
Since "pivot" means a U-turn or reversal, then "Fed pivot" must mean the opposite of rate hikes i.e. rate cuts. But buyers of treasuries, yen and metals may have different ideas as to what actually constitutes a pivot? Everyone rushes to say a pivot is a rate cut. Yet, we should weigh the meaning in terms of market impact. I would consider a pivot to be an official pause from rate hikes, or, a bigger than expected dovish dissent at the September FOMC. Any of the last two could give considerable boost to treasuries, yen and metals. Do not limit your thinking to only “rate cuts”.
Finally, by the way these cycles are shortening, we could well enter a prolonged period of slow-flation mixed between contractionary and expansionary sectors.
Look at USDJPY vs US 10-year yields. What do you notice?Latest IMTs
-
2x our Gains in 8 Weeks
by Ashraf Laidi | Feb 3, 2026 10:28
-
4500 and 72 Hit, now what?
by Ashraf Laidi | Feb 2, 2026 2:22
-
Warsh Odds Hit Metals
by Ashraf Laidi | Jan 30, 2026 10:56
-
Time Stamp تجزيء زمني للفيديو
by Ashraf Laidi | Jan 29, 2026 9:09
-
Trump Hits Dollar but Wait Bessent & Powell...
by Ashraf Laidi | Jan 28, 2026 11:47


