Trading S&P500: Reversal or Consolidation?
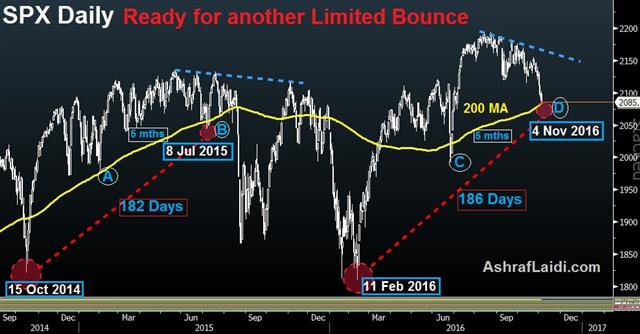
Stepping away from US Elections and into the charts, the S&P500 looks to bounce off its 200-DMA after testing it for the 1st time in 5 months (Point C on the right chart), which is similar to the 5-month duration spanning the 200-DMA retest in Jul 2015 (point B on left chart) and yields crash low on October 2014 (point A on left chart). More significantly, Friday's retest of the 200-DMA spans a 186-day period from the February low, again, similar to the 182 days between the October 2014 low and July 2015. The parallel in structure of the intermediate lows and their relative positioning as well as the shape of the 200-DMA cannot be ignored. Recall the SPX consolidated for 4-weeks following the July 2015 bounce off its 200-DMA before collapsing in that infamous August Monday 2015. Is it time for these charts patterns to break out of the pattern? I will discuss this in tonight's Premium video and shed light on the decision to close our Premium trades in the DOW30, DAX30 and USCRUDE over the last 6 days for a 1085-pt gain (Dow 295 pts, DAX 470 pts and 320 pts). There are remaining shorts in indices as well as open trades in FX and indices.
Latest IMTs
-
Iran Polymarket & Fed Odds
by Ashraf Laidi | Feb 20, 2026 11:27
-
Gold, Iran & Oil
by Ashraf Laidi | Feb 19, 2026 16:40
-
Trade Already in Profit
by Ashraf Laidi | Feb 17, 2026 18:16
-
I will go LIVE in 10 mins
by Ashraf Laidi | Feb 16, 2026 21:49
-
3 Stocks Against Nasdaq
by Ashraf Laidi | Feb 13, 2026 17:46


