Win for Hard Data but Loss for USD
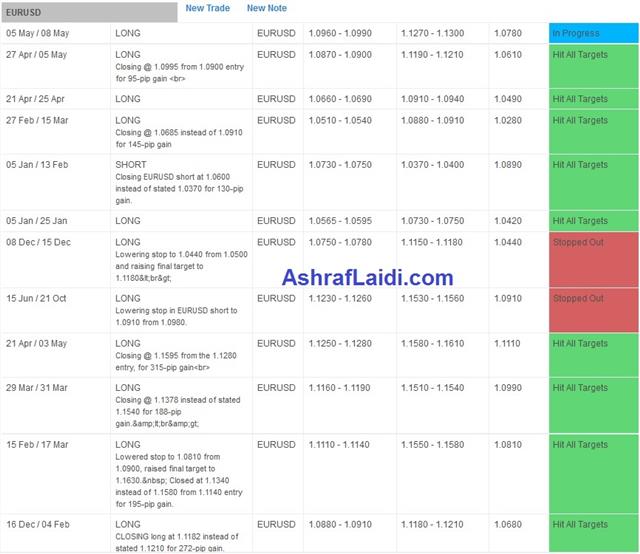
After months of improved manufacturing PMIs, US industrial production beat estimates. But it didn't provide a lift to the US dollar, which was the laggard on the day, allowing the euro to climb near 1.11. Australian wage data is due next. The matrix below highlights the 12 trades in EURUSD issued by the Premium Insights since December 2015. 9 out of 12 trades were closed at a profit with a net gain of 865 pips assuming clients entered at the higher (lower) end of the long (short) trade and opened ONLY one trade per recommendation. More on the methodology here.

Industrial production rose 1.0% in April, beating the 0.4% consensus estimate. Manufacturing production and capacity utilization were also better than forecast in a sign that hard data is catching up to soft data, as the Fed expects. Housing starts and building permits fell unexpectedly.
The problem is that it's going to take much more than one report. The US Citi Economic Surprise Index is the G10 laggard and at the lowest in a year.
The dollar suffered for the second day, partly because US housing starts were soft. Technically, the break in EUR/USD above 1.10 is significant, partly helped by Eurozone GDP. That level held early in the month but was blown out Tuesday and extended as high as 1.1097, which is the best since election night in the US.
USD/JPY also fell below 113.00 in the first real retracement in a month. USD/CAD fell to the lowest since April 26 but an unexpected crude storage build in the API report early in Asia is a threat to the loonie.
The Australian dollar has climbed for five consecutive days after falling for the five days before that. The bounce has only been half as large as the drop. That could change at 0130 GMT with the release of the Q1 wage price index. It's forecast to rise 0.5% q/q and 1.9% y/y. Anything within 0.2 pp of those numbers is unlikely to cause ripples.
What could cause waves is any fresh worries from China. The Shanghai Composite has climbed for four days after a month-long swoon.
| Act | Exp | Prev | GMT |
|---|---|---|---|
| Capacity Utilization Rate | |||
| 76.7% | 76.3% | 76.1% | May 16 13:15 |
| Eurozone Flash GDP (q/q) | |||
| 0.5% | 0.5% | 0.5% | May 16 9:00 |
| Wage Price Index (q/q) | |||
| 0.5% | 0.5% | May 17 1:30 | |
| Building Permits | |||
| 1.23M | 1.27M | 1.27M | May 16 12:30 |
Latest IMTs
-
3 Stocks Against Nasdaq
by Ashraf Laidi | Feb 13, 2026 17:46
-
Revisiting Gold Bugs Ratio
by Ashraf Laidi | Feb 13, 2026 11:10
-
Typical Trading Errors
by Ashraf Laidi | Feb 12, 2026 10:04
-
Trade Tips from Washington DC
by Ashraf Laidi | Feb 11, 2026 9:56
-
The Signal is Finally Here
by Ashraf Laidi | Feb 10, 2026 11:09


