

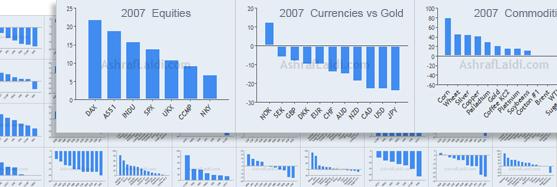
21-year Intermarket Charts - 7 indices 11 currencies 14 commodities
The only interactive charting of its kind on global markets to give traders, analysts and market buffs a strong grasp of multi-market patterns in order to understand the past and help anticipate future moves.
-Which currency had the longest period of outperformance? -What is the “January Effect” in currencies and what it means for 2014? -What did USD, JPY and GBP have in common in their relation with gold? -How did the two oil-based currencies (CAD & NOK) perform against each other over the last 21 years? -Which agricultural commodity rallied for the most of number of years -Which index advanced by the most prior to the housing crash (1993-2007)?
Interactive charting by market, instrument and chronological order. CLICK HERE FOR MORE
Latest IMTs
-
Gold Conflunce Levels
by Ashraf Laidi | Oct 22, 2026 16:49
-
Trading Nasdaq Gaps
by Ashraf Laidi | Oct 22, 2026 14:19
-
My English Webinar at 1pm London
by Ashraf Laidi | Oct 19, 2026 9:31
-
Gold Hourly & Daily
by Ashraf Laidi | Oct 16, 2026 13:59
-
Gold vs Silver & the Ratio
by Ashraf Laidi | Oct 15, 2026 13:02