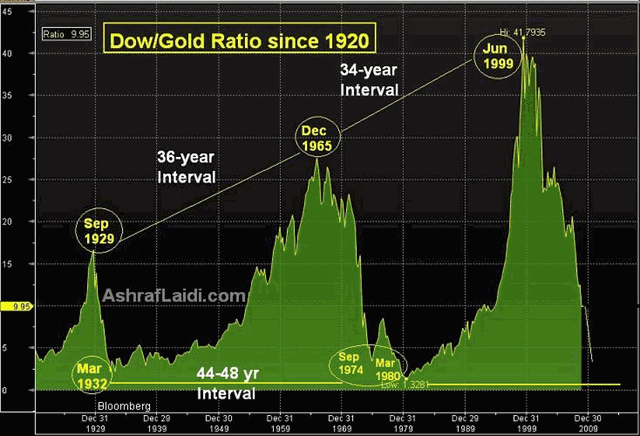
Equity/Gold Ratio's 40 yr Cycle
Equity/Gold Ratios
June 1st Update at Bottom of the Section
With gold prices only 7% away from their record highs and the main equity indices 45-50% below their highs, an analysis of the equity/gold ratio is amid the many rationalizations for prolonged gains in the precious metal. The equity/gold ratio highlights a commonly used measure of corporate market value versus a decades-long measure of real asset value. Gold is known as a measure of real assets value because of its ability to preserve value during inflationary times. But during these disinflationary times, the current global growth/demand landscape also supports the notion of too many dollars chasing too few gold ounces.

The equity/gold ratio (using the Dow or S&P500) has fallen about 85% from its 1999 peak, which occurred when gold stood at 20-year lows and equities reached their highs at the top of the dot-com bubble. Since the 1920s, the equity/gold ratio has peaked twice at nearly 35-year intervals: 1929 to 1965, and 1965 to 1999. After each of those three peaks, stocks descended in multiyear sell-offs, accompanied by a rally in gold. But the converse was not true when stocks recovered in 2003-2007. As the chart shows, the 2002-3 start of the commodity-wide bull market failed to prevent equity/gold rally from extending its decline.
The 100 years of equity/gold analysis indicate each peak in the ratio was followed by a full retracement back to the preceding lows. The emerging fundamentals indicate a recurrence of this trend and the equity/gold ratio has further declines ahead until a possible recapture of the 1980 lows. In 2002-2007, the falling ratio emerged on a rally in both equities and gold, albeit a faster appreciation in the latter. From 2008 to present, the persistent decline in the ratio emerged on a combination of a divergence in the pace of declines (slower fall in gold than in equity indices) or divergence in the direction (rising gold and falling/neutral equities).
In assessing the interaction between gold and monetary assets, it is worth weighing in on the current gold rally by comparing the amount of gold available versus the creation of monetary assets. Just as equity/gold ratio stands at 18-year lows, the ratio of total financial assets to physical gold is near the low end of its historical range. Additionally, The worlds available gold stock stands at a mere 5-6% of total global stock and bond market valuation, which is about 4 times lower than in 1980s. It is no coincidence that the difference between todays gold/equity ratio and that of the 1980 low was also 6 times greater.
The Road Ahead
A return in the equity/gold ratio towards the cyclical lows of 1980 is highly plausible. Rather than simply arguing this point on the basis of further declines in equities (see yesterdays note in my website on long term equity cycles), the prospects for prolonged gold rallies are emboldened by the refuge towards the metal as a yield substitute resulting from emerging depreciation in the secular value of currencies. And as we have seen in 2005-7, returning rate hikes pose no challenge to gold. Instead, higher rates are accompanied by improved global growth, resurging demand for industrial commodities and a broader backdrop for the precious metal. The all time lows of 1980 in the Dow/gold and S&P500/gold ratios stood at 1.33 and 0.18 respectively, compared to the current levels of 7.8 and 0.81. Assuming a return in the ratios to their 1980 lows, these would have to fall by another 75%-80%. Taking a more conservative scenario of a 50% decline in the equity/gold ratio and a target gold price of $1,250-1,300/ounce, the implied value of the Dow and the S&P500 would stand at 4,500-5000 and 500-520 respectively.
For more on the market and economic implications of gold ratios with oil, equity and commodity indices, see Chapters 1, 8 and 9 of my book Currency Trading & Intermarket Anlaysis.
June 1st Update
The 30-35% rally in equities since early March 2008 has lifted the Dow/Gold ratio from its 7.0 low to 9.4 before treating to 8.7 in June 1st. The chart below shows the relationship since Jan 2008, revealing 6 major rebounds in the D/G ratio. Throughout May, we have seen that neutral-to-positive equities have been unable to deflect funds from gold because of the ensuing recovery theme in emerging markets. Any good news for China is good news for metals demand. The dollar's weakness as well as expectations of further Treasury purchases by the Fed have played a major role in boosting gold. Watch the 9.7-9.8 level as the resistance for the D/G ratio.


The 30-35% rally in equities


