Intraday Market Thoughts Archives
Displaying results for week of Feb 16, 2020Gold Eyes 1680 ahead of G20
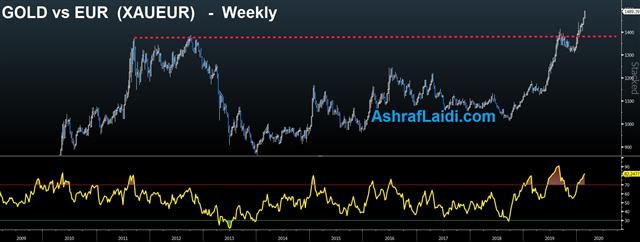
As the excesses of USD-bound safe haven flows hit a wall of data disappointments courtesy of a sub-50 composite PMI, gold extends its rally, picking the yen up along with it at the expense of new record lows in US bond yields. Now that Fed rate cuts are back on the table (they never left) as the US yield curve inversion deepens in 2 out of 4 measures highlighted here, USD traders shift attention from safe haven flows to Fed easing pricing (40% of July rate cut). Add to it the inevitable statements/misinterpretations/clarifications about USD strength at this weekend's G20 meetings of finance ministers and central bankers, and you're likely to see further playing out of gold appreciation a la 2011 analog in the charts below.

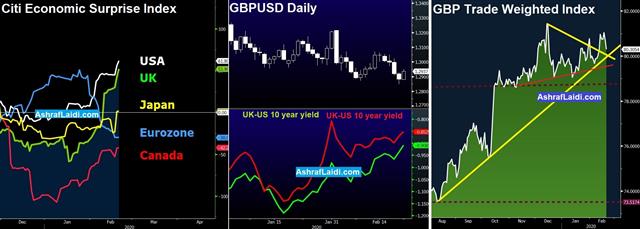
3 Charts for GBP Traders
GBP traders step back and take a look at 3 key charts: GBP trade weighted index, Citi's economic surprise index (UK vs the rest) and UK-US yield gap on 10- and 2 years bonds. Full charts and analysis.
Is Yen-Centric Risk Back?
The yen plunge of the past two days threatens to re-write the rules of trading JPY. We look at the move and the disjointed risk picture it unravels. Indices are tumbling across the board after high profile failure to follow-through the highs, while gold rises to its highest level relative to S&P500 in 2 weeks. Take a look at the historical GOLD vs YEN chart below. Ashraf asked imagine how low would the S&P500 be today if ETrade did not rise 24% as a result of Morgan Stanley's aquisition of the online broker.
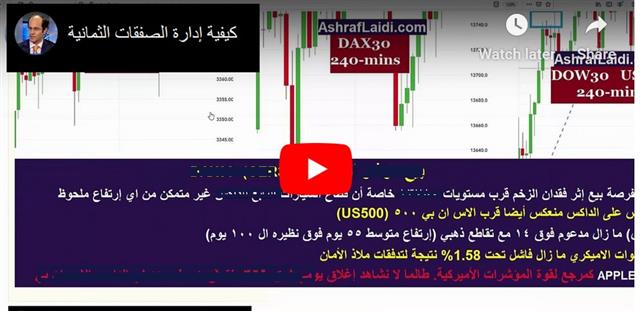
كيفية إدارة الصفقات الثمانية فيديو للمشتركين
The playbook in yen trading for a generation has been to largely ignore Japanese fundamentals because ultra-low rates even in relatively good times cemented its status as a funding currency. In addition, huge Japanese overseas investments and the tendency to bring them home in times of global uncertainty solidified it as a safe haven currency.

Is that dual axis breaking down? It's far too early to draw any conclusions but the latest drop in the yen is undoubtedly country-specific. There is some element of risk appetite in play but gold is at 7-year highs and Treasury yields remain a hiccup away from yearly lows.
What changed is a brutal GDP report at the start of the week. The 6.3% annualized drop is breathtaking and while a 3.8% fall because of the sales tax hike was anticipated, that's a much bigger decline. Without annualizing, it's a 1.6% q/q decline, wiping out all the growth since mid-2017. It was followed up Wednesday by a poor machine tool orders report and the yen breakdown began shortly afterwards.
The message of the market might be twofold:
1) That the BOJ will have to reach deeper into experimental policy. They've already crossed many previously-unthinkable thresholds and every step further risks an dramatic loss of confidence in the currency;
2) The sharp drop in growth in Q3 shows that consumers and the economy can't withstand a tax hike and that raises this risks of an accelerating debt spiral and loss of confidence;
3) Coronavirus is now a consideration. Certainly Japan is at a higher risk of an immediate outbreak than the US or Europe but if it travels regionally next, it almost-certainly ensures it will be a global pandemic in weeks or months so the time mismatch shouldn't matter. Some say Japan was betting heavily on the summer' Olympics. Would the virus cause visitors to stay away from the Land of the Rising Sun?
4) The yen is no longer the only funder. It's not a coincidence that this takes place as the euro and Eurozone yields continue to fall. In many ways – particularly on the deficit side and monetary policy side – the euro makes for a better funding currency. This is something we have been highlighting for months and will be exploring more in the weeks ahead.
Again, we have to emphasize that it's far to early to anticipate any kind of structural shift in the FX market. A number of factors are in play including technical breaks and a squeeze above 110.00 in USD/JPY and a breakout from unusually low volatility. A change in regimes isn't going to happen overnight, but we're watching closely.
Why the Euro Keeps on Falling
Before we cover the euro, we must give mention to the yen's breakdown as USDJPY penetrates the 110.10 resistance to a 9-month high of 111.32. The move emerges alongside a new high in the SP500 and DAX30, while DOW30 attempts to regain 29400. China's annnouncement of further support for affected supply chains has helped sentiment. The USDJPY short was finally stopped out as stops cascaded through 111.30s. CAD and EUR are the only gainers vs the strengthening USD. US building permits were string but housing starts fell. Canada CPI was mixed. All eyes turn to the FOMC minutes and any new insights on the Fed's balance sheet. A new Premium trade has been issued to clients in a non-FX markets, backed by 3 charts and 5 bullet points.
EUR/USD is up today, but has fallen in 3 out of the last 13 sessions.
The euro has fallen virtually every day this month and the number one reason is economic – date is soft and Europe is most-vulnerable to a slowdown in global growth. The 'expectations' component of Tuesday's ZEW sentiment survey fell to +8.7 from +26.7; far short of the +21.5 consensus in the latest example.
Another factor is that the euro has solidified itself as a low-yielder, something we have been highlighting for months. Bloomberg highlighted how single-A rated LVMH was able to launch the largest issue of bonds since 2016 in Europe and sold some of it with a negative yield. Those borrowing conditions are going to entice foreign companies to borrow in euros and that's exactly what Warren Buffett did in the summer.
The third crucial factor is China. Owing to the trade war, China-US trade has been the focus of the past two years but Europe-China trade is arguably more important. Europe is highly-dependent on exports to China and its slate of exports – like autos – are more economically dependent than US sales, which are now buffered by the phase one trade deal. In short, Europe is more vulnerable to coronavirus weakness than some other places (but certainly not all).
Finally and critically, the eurozone has hamstrung its ability to respond to an economic downturn with strict fiscal rules. Markets are increasingly convinced that any economic weakness in the US, China, UK and commodity bloc will be met with fiscal stimulus. That's not the case for the eurozone.
Along the same lines, the FOMC minutes are due at 1900 GMT and could offer clues into how inclined the Fed is toward cutting. The market is now pricing in an 82% chance of a cut in July.
Forex Brokers' Share Price Performance
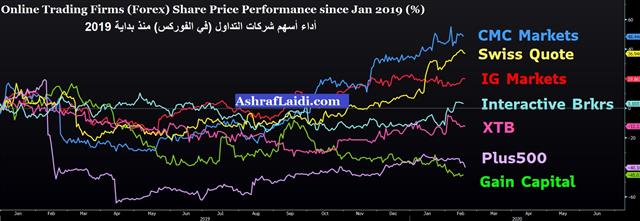
Since our last update 6 weeks ago on Forex brokers' share price performance, CMC Markets' share price remains in the lead from Jan 2019 til today. What about this year? Who is up 29% over the last 49 days? And who's down 12% over the same period. Full analysis here.
Energy Shadows Apple
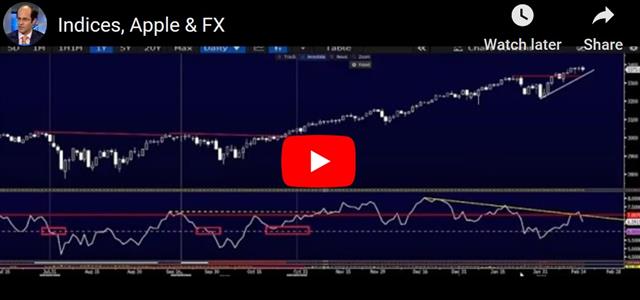
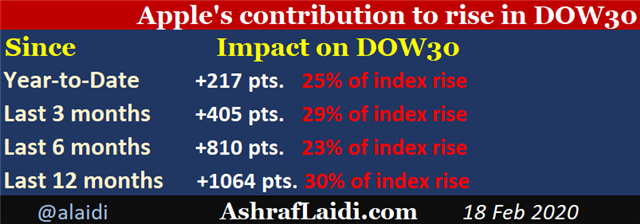
As US indices post their biggest daily decline in over a week following Apple's warning fallout, here are some facts to bear in mind: Apple has contributed to 217 pts in the rise of the Dow Jones industrials index (or 20% of the index rise) since the start of the year. Over the last 6 months, Apple's rise made up 810 pts or 23% of the DOW30's rise. As we speak, Apple pared down its day's losses from 4% to 2% and ironically, the worst performing sectors are energy, financials and industrials, only to be followed by technology. Utilities were the best performing sector of the day and the 2nd highest performing sector year-to-date. For a defensive sector such as utilities to have a robust performance at a time when stocks are near their highs reflects the uneasy nature of this rally. If history is any guide, Apple's selloff will last for at least 4-5 weeks. More of that is discussed in today's video Premium subscribers.
داخل ديناميكيات آبل والداو جونز
قبل أن نقيس تأثير “آبل” على مؤشر الداو جونز، إليكم بعض الاعتبارات الهامة. التحليل الكامل
Another Japanese Recession?
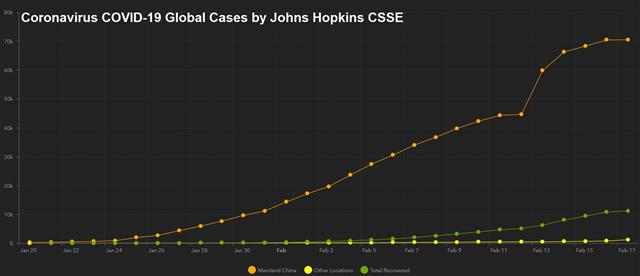
Global stocks pushed higher on the narrative of slowing growth in the number of coronavirus cases, which reached 71,810. The PBOC injected additional short term funds. US equities will close in observance of President Day Holiday but futures will remain open. CAD is the strongest performer, dragging USDCAD towards its 200-DMA. Japan is paying the price of another sales tax, seeing its biggest growth contraction in over five years. A new Premium trade was posted late Friday, bringing the number of open trades to seven. More below.
The world's third-largest economy erased all of the growth in 2018 and 2019 plus more in the final quarter of last year. Growth contracted by 1.6% in the quarter compared to 1.0% expected. That's an annualized pace of -6.3%. Even worse, growth in Q3 was revised down to +0.1% from +0.4% q/q.
The drop was the largest since 2014 in a quarter when the sales tax was also raised. This time, however, the economy faces a second hit from coronavirus and a local drought. The number of cases on the cruise ship quarantined in Japan have risen to 355 including 70 more on Sunday. The global total is now nearing 72,000 with 1,775 dead.
Nearby Thailand and Singapore both lowered GDP forecasts on the weekend. New Zealand's PM also warned of an H1 hit.
On Friday, US January retail sales numbers disappointed. The control group was flat compared to +0.3% expected and the prior was revised to +0.2% from +0.5%. Optimists pointed out that falling clothing prices caused a one-off blip while the pessimists note that average growth in the control group in the past six months is 0%.
The US is on holiday Monday so that may keep trading light.
CFTC Commitments of Traders
Speculative net futures trader positions as of the close on Tuesday. Net short denoted by - long by +.EUR -86K vs -75K prior GBP +21K vs +13K prior JPY -26K vs -21K prior CHF +4K vs +5 prior CAD +10K vs +19K prior AUD -33K vs -43K prior NZD -4K vs -2K prior
Specs were on the right side of the EUR/GBP last week and benefitted further from the late-week rally in the pound. The market is now fixated on the upcoming UK budget and the hope for fiscal spending. Watch for leaks.


