Intraday Market Thoughts Archives
Displaying results for week of Dec 24, 2023Unprecedented Global Macro Sequence

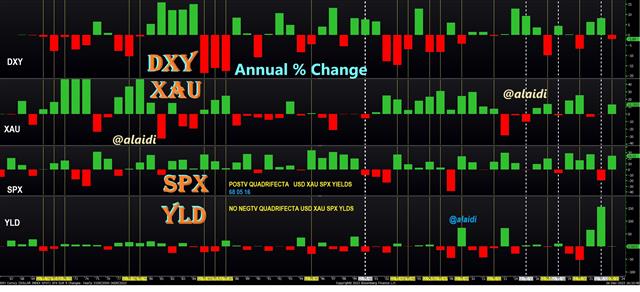
Let's add 10-year bond yields to the mix. So far yields are down 0.7% YTD, which means they need to close the week/year above 3.88% to end the year positive and make it 3 consecutive annual gains, something not seen since 1979/81.
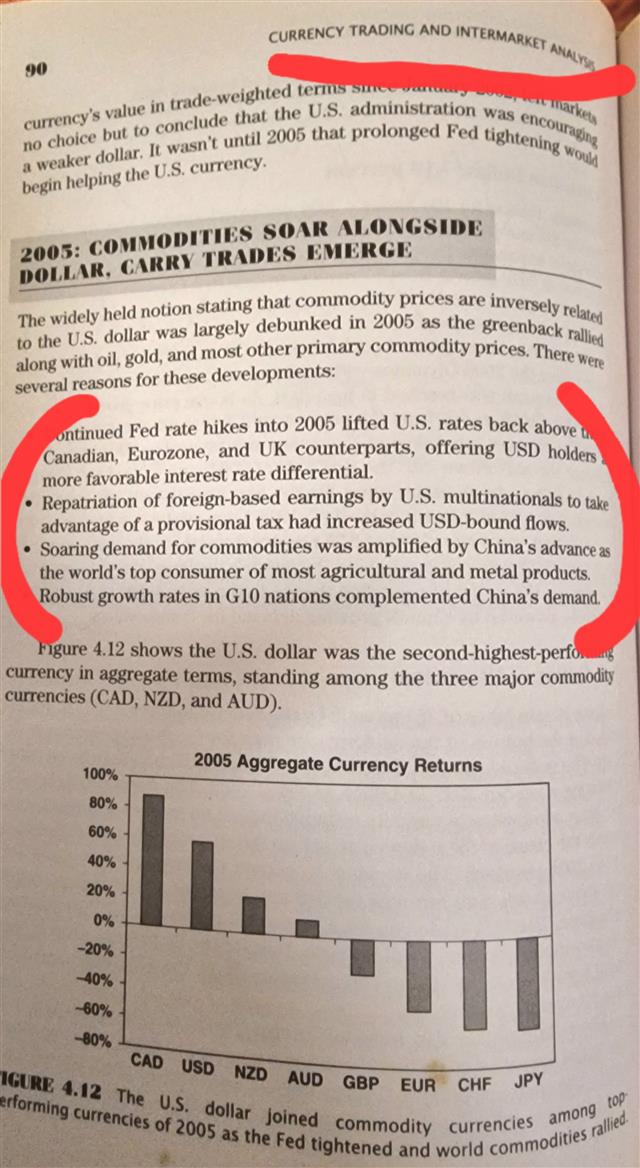
What about quadrifectas? Have we ever seen a year with an increase (or a decline) in all four? (XAUUSD, SPX, DXY & 10-yr Yields). A negative quadrifecta has never happened according to available records since 1968. A positive quadrifecta, however (rising XAUUSD, SPX, DXY and 10-yr yields) occurred in 1968, 2005 and 2016. I vividly remember the reasons behind the quadrifectas of 2005 and 2016, with 2005 involving the post-DotCom recovery and China's construction book, boosting equities, commodities, growth and yields. But why did USD rise in 2005 despite the ascent of gold and equities? The reason to that rare exception was the 2004 tax holiday introduced for US multinationals by George W Bush, incentivising CEOs to repatriate foreign based earnings at a reduced rate. The result was an exceptional $312 billion wall of money repatriated into the US, propping the US dollar across the board. For more detail on this policy and how USD performed in 2005, see the snapshot below from Chapter 4 of book.

What about the 2016 quadrifecta of rising XAUUSD, SPX, DXY and 10-yr yields? Simple-- It was all down to one single event, namely Donald Trump's presidential election victory, whose promise of America First, subsidising local industry along the combination of ultra loose fiscal policy and restrictive monetary policy, helped push all four asset metrics.
Looking ahead
One thing that's comforting for the bulls is that the SPX never (since 1962) had alternated from a losing year, an up year and another down year. If this pattern persists, then 2024 will be in the green. The last time SPX fell in one year, rose the next, followed by another down year was in (1960, 61, 62) and (1946, 47, 48). Other such combinations were in the depression-era of the 1930s.Fractious & Messy Year Ahead
The greatest risk to the stock market in 2024 (bonds & metals) is the scaling down of market expectations for rate cuts as a result of renewed gains in inflation. Any credible and consistent signs of renewed inflation (not one-off bounces or base effects) would be punishing for markets. But even if you think the probability of such inflation rebound is minimal, there is always the typical volatility in a US presidential election year. According to seasonality studies strecthing to 1900, April and May tends to be challeging months during US elections years, but October fares worst as far as consistency of selloffs. A third risk is that of persistently swelling budget deficits and the ever expanding amounts of new debt issues to refund existing deficits. This could easily ignite another "bond market event" similar to September 2019, March 2020 or September 2022 in the UK.Tackling the Unprecedented Sequence
So back to that unprecedented sequence mentioned in the 1st paragraph. It's not rare to see a rise in USD and yields with a decline in gold and SPX (2022, 2018, 2015). But why we never saw the total inverse of that pattern in the following year until now? One possible explanation could be the increasingly fragile nature of US and global economies. A 3rd straight annual increase in the USD would have dealt a lethal blow to the financing of increasingly desperarate emerging markets and seized up the bond market. The populartity of risk-parity portfolios hedging equities with bonds also explains why asset managers could not afford another down year in both asset classes, especially after 10yr yields shot up an unprecedented +150% and SPX down 20%. Despite the fundamental promise of technology stocks (chip designers, manufacturers, AI plays and cyber security sectors), the risks of recurring inflation and a bond market event remain significant. The case for Bitcoin remains solid (argued in detail in this post), and we exploited the rally by telling our WhatsApp Broadcast Group about bitcoin miners back in spring. We started with HUT, MARA, RIOT, then build our way into IRENT and BITF after selling HUT in autumn. This is explains the 6-1 relationship between Bitcoin Miners and Bitcoin, discussed in this recent video hereEnglish Translation of Latest Video
I've added English translation to my latest Arabic video so please activate the Close Caption "CC" option your Youtube settings. The translation is out of synch but 100% accurate. CONTENTS INCLUDE: Gold current standing in its weekly cycle, 6-1 Miners/Bitcoin relationship, Fed expectations, difference between Santa Rally & January effect and latest on AMD, NVDA, MU, ROKU, U and CAVA. Full video.
دورات الذهب و تغييرات محفظة الأسهم


Solana Dominates Statistics
Excuse me for disturbing your holiday with a random post about cryptos. You should all know by now that Solana has risen an astounding 1040% so far this year surpassing $114. Yes, I know several other crypto currencies have risen 3000 and 5000 this year, but Solana is no silly altcoin with 5 decimals to the left that makes you excited for 2 days before bankrupting you later in the week. Solana has now reached the top rank of Decentralized Exchange Volumes (DEX) at 40%-- meaning it has processed 40% of all decentralized exchange transactions, surpassing Ethereum, Polygon and Avalanche. It has also hit the top rank of decentralized active users (DAU) ahead of Ethereum, Cardano, Polygon and Avalanche. Finally, Solana reached 3rd in the ranking of market capitalisation (excluding Stable coins). I remember entering Solana in spring of 2021 near $60 setting a target of $200, but allowed greed to get the best of me, staying through the $259 peak and watched it retrace more than 70%. Today is a different story. I informed our WhatsApp Broadcast Group over the weekend about my crypto portfolio (Bitcoin, two altcoins and a basket of BTC miners). Solana is one of those two altcoins. As traders realise Solana broke above the psychological $100 level but is 150% below the record high when fundamentals were far below current levels (adoption, use, ecosystem), imagine the wall of new money. Merry Christmas.


