

Intraday Market Thoughts
Gold metric Working so far
by
Aug 3, 2026 12:32
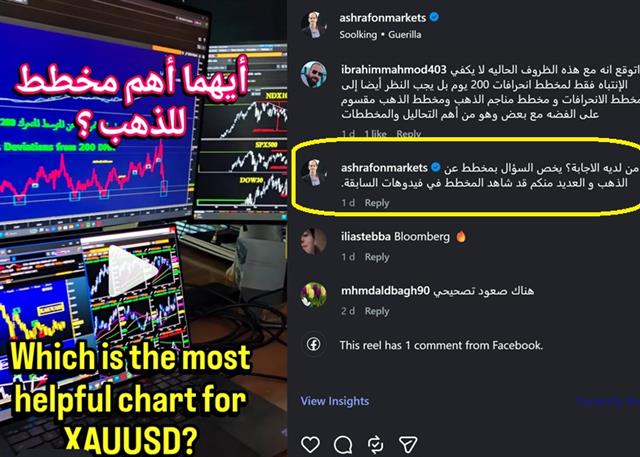
The answer to the question in this video is plain and simple. It is the chart with the RED graph and whose labeled title is in GREEN in Arabic and English. What does the red graph in the lower window show? It's a clear horizontal support. Watch here.
Latest IMTs
-
Gold's Triangle Base Held
by Ashraf Laidi | Oct 5, 2026 10:21
-
What's Special about Gold?
by Ashraf Laidi | Oct 2, 2026 12:21
-
Gold Silver Update
by Ashraf Laidi | Sep 30, 2026 9:38
-
English Webinar Starts now
by Ashraf Laidi | Sep 28, 2026 10:49
-
GoldBugs Index Update
by Ashraf Laidi | Sep 24, 2026 12:05