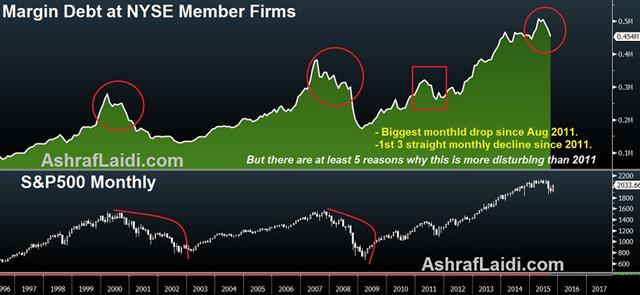
Margin Debt Decline Biggest since 2011
Margin debt balances at NYSE member firms sustained a $19.5 billion decline (-4.1%) in September, the biggest monthly fall in margin utilisation since August 2011 ($33.9 billion or -11%), when the Eurozone markets were damaged by heightened fears of an Italy exit from the Eurozone and the US credit rating was downgraded by S&P. The September decline marks the 3rd consecutive monthly drop— the longest losing streak since 2011.

Worse than 2011?
Such recurring comparisons to 2011 lead us to reiterate the point that today's macro and market dynamics are more worrisome than four years ago. Here is why:1. The global economy was supported by vital portfolio and infrastructure investments from China and the Gulf nations. Today, China is at the cusp of a deflating credit bubble and the effect of its falling demand is extending onto US household stocks (WalMart, Apple and Caterpillar).
2. China's currency devaluation may ease the threat on exporters and relieve the currency headwind on USD-denominated borrowers, but its impact on the rest of the world is the antithesis of QEs from the Bank of Japan and European Central Bank.
3. Gulf nations' retreat. Injections from MidEast and FarEast sovereign wealth funds were instrumental in stabilizing global markets in 2007-9. Today, reports that Saudi Arabia's Monetary Authority has withdrawn as much as $70 bn over the past six months along with Qatar's stock holding losses in Glencore and Volkswagen have sobering implications for global liquidity as these restructure their portfolios to withstand budget imbalances resulting from falling energy prices.
4. Unlike in 2011 when Fed's QE was seen as a “novelty” and neither the ECB nor the BoJ had yet contributed with their stimulus, today's economy is all QEd out to the point that the IMF and central bankers are admitting to the limitations of prolonged QE.
5. Slowing global trade, deepening China macro retreat, plunging commodities, falling capex and +$1.5 trillion in cancelled oil projects are all witnessed today. These were certainly not present in 2011.
Margin calls & forced selling
The high correlation between margin debt and equities reflects the increasing use of debt in purchasing stocks by institutional and retail investors, shedding important light on the circular loop between price performance and the use of margin debt.1-3 month lags
July 1998 – The stock market top of July 1998 coincided with the peak in margin debt before the decline was propagated by the EM fallout & LTCM collapse.March 2000 -- The peak in margin debt of March 2000 coincided with the market high in the S&P500 right before the burst of the dotcom bubble, which was intensified by a new generation of margined trading, made easy by online trading.
July 2007 -- The peak in margin debt of July 2007 occurred three months prior to the pre-crisis top in the market.
The 1-month lag has reappeared as the latest margin debt figures show leverage has fallen 10% from its April peak -- one month prior to the record high in the S&P500 and the Dow. The stock market's bounce of the last four weeks is likely to remain with us until early November, with additional gains fading at the +3% threshold. Our subscribers have already taken positons in the Dax and the FTSE-100.
Latest IMTs
-
2x our Gains in 8 Weeks
by Ashraf Laidi | Feb 3, 2026 10:28
-
4500 and 72 Hit, now what?
by Ashraf Laidi | Feb 2, 2026 2:22
-
Warsh Odds Hit Metals
by Ashraf Laidi | Jan 30, 2026 10:56
-
Time Stamp تجزيء زمني للفيديو
by Ashraf Laidi | Jan 29, 2026 9:09
-
Trump Hits Dollar but Wait Bessent & Powell...
by Ashraf Laidi | Jan 28, 2026 11:47


