Yen Extremes & Opportunities
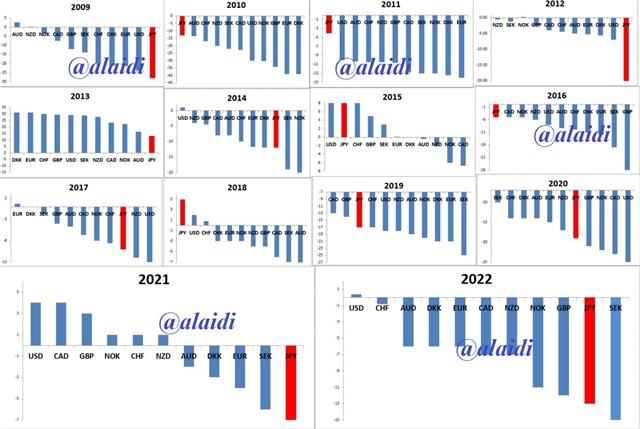
CURRENCIES PERFORMANCE VS GOLDClick To Enlarge

You will note that in the 14 years between 2009 and 2022, the yen has mostly been the weakest or strongest currency of the year. Weakest in 2009, 2012, 2021 and 2nd weakest in 2022. Strongest in 2010, 2011, 2016 and 2018. In three other years (2014, 2015, 2017 and 2019) the yen was nearly the strongest or the weakest of the year. Hardly ever the yen's performance was middle of the range.
How about the same charts for yen and others going back to 1993? No problem, just click here
What will you notice? You will find the yen's risk-off or risk-on function well at work, performing on either opposite ways of the strength spectrum. Although we have never seen the yen at its weakest over two consecutive years, 1995-1996 and 2021-2022 were close. How? The yen was the weakest in 1995 and 2nd weakest in 1996—just like 2021 and 2022. So what happened in 1995-6? The BoJ cut rates down to 0.5% in 1996 from as high as 6.0% in 1990.
Can the yen pull off a recovery in 2023? You have 30 years' worth of charts to help you conclude that the yen can easily make the transition from weakest G10 currency in one year, to strongest the next. Will it be a retreat in yields? Will the Bank of Japan finally end yield curve control? I could also bring up gold and its relationship with the yen--not to mention equity indices. So much to ponder, so many frameworks to consider. Enjoy the Holidays and best wishes for a busy, happy and healthy new year.
Latest IMTs
-
Warsh Odds Hit Metals
by Ashraf Laidi | Jan 30, 2026 10:56
-
Time Stamp تجزيء زمني للفيديو
by Ashraf Laidi | Jan 29, 2026 9:09
-
Trump Hits Dollar but Wait Bessent & Powell...
by Ashraf Laidi | Jan 28, 2026 11:47
-
Retail Traders' Hastiness
by Ashraf Laidi | Jan 27, 2026 9:40
-
From Silver to Yen
by Ashraf Laidi | Jan 26, 2026 11:55


